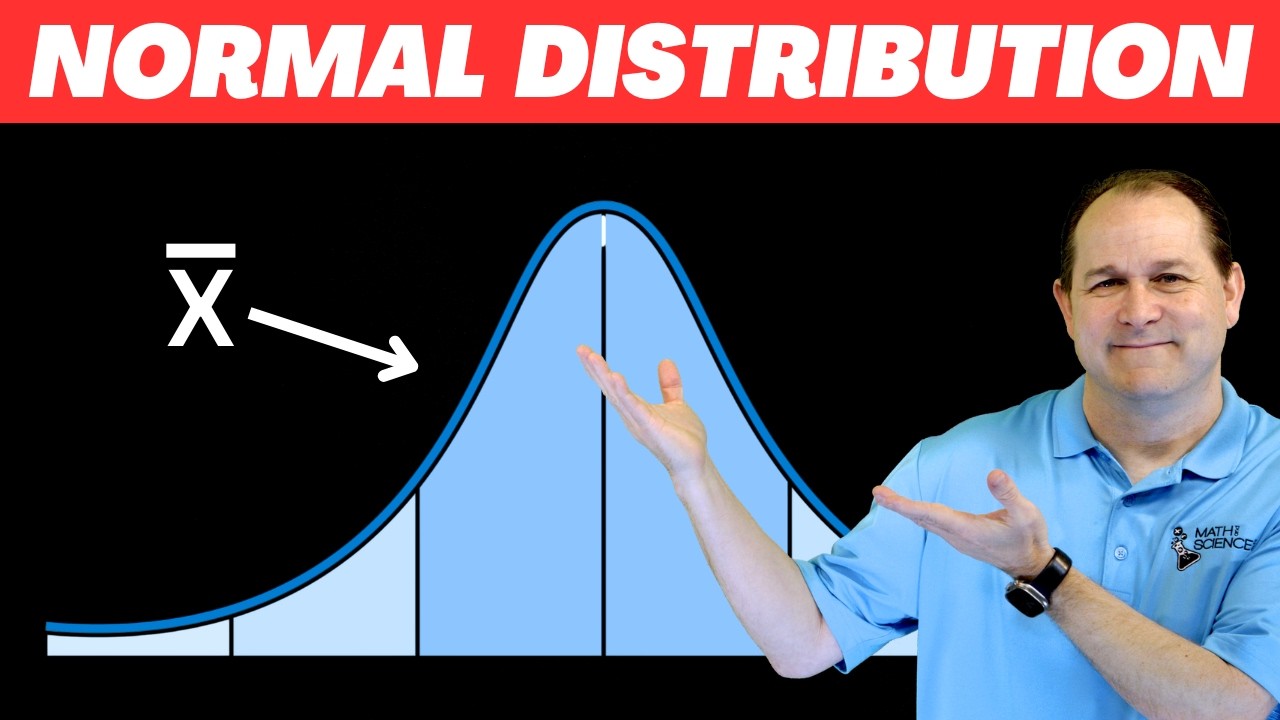
What the Area Under a Normal Distribution REALLY Means
Keywords
Summary
154 words
Critical Evaluation
Value of the Information & Strength of the Argument
The video provides a solid conceptual foundation for understanding the area under the normal distribution as probability. It effectively uses visual aids and relatable examples to illustrate the relationship between the curve, standard deviation, and probability. The argumentation is clear and logical, building from basic definitions to the interpretation of shaded areas. However, it does not delve into the mathematical derivation or the use of Z-scores, which limits its depth. The explanation is accurate and aligns with standard statistical teaching, making it valuable for beginners.
Scientific Rigor, Source Quality, Title Accuracy
The video is scientifically rigorous in its conceptual explanations, with no factual errors. It does not cite external sources, but this is typical for introductory tutorials. The title accurately reflects the content, which focuses on the meaning of the area under the normal distribution. The presentation is clear and well-structured, though it lacks references to further reading or advanced topics. Overall, the content is reliable for its intended audience.
169 words
Title / Content Match
The title accurately reflects the content, which focuses on the meaning and interpretation of the area under the normal distribution curve.
Quality & Reliability
7/10
The video provides a clear and accurate conceptual explanation of the area under the normal distribution as probability, with correct use of standard deviation and inflection points. It is a tutorial aimed at beginners, and while it lacks rigorous derivations or citations, the content is mathematically sound and aligns with standard statistical principles.
Key Moments
Markers derived by PSI from the transcript: the creator did not define chapters.
- Introduction to the normal distribution and its parameters (mean and standard deviation).
- Explanation of inflection points and their relation to standard deviation.
- Example with watermelon sizes: finding probability of less than 15 inches.
- Example of probability greater than 20 inches, shading to the right.
- Reiteration that total area under the curve equals 1, and probabilities are between 0 and 1.
- Summary and preview of upcoming lessons on using tables for calculations.
Contribution & Novelties
The video offers a clear and accessible explanation of the area under the normal distribution, emphasizing the conceptual link between area and probability. It is particularly effective for beginners, using visual and intuitive examples. While it does not introduce new mathematical concepts, it reinforces foundational understanding.
Pour aller plus loin :
- Normal distribution — Provides comprehensive mathematical details and properties.
- Standard deviation — Explains the concept of spread and its calculation.
- Probability density function — Discusses the function that defines the normal curve and its area interpretation.
87 words
Radar Profile
The radar profile shows moderate scores across all dimensions, with slightly higher quality and reliability compared to quantity and technical depth. This indicates a well-explained but introductory tutorial that prioritizes clarity over comprehensive coverage.