Visualizaciones Intermedias y Transformación de Datos
Keywords
Summary
127 words
Critical Evaluation
Value of the Information & Strength of the Argument
The video provides valuable, practical information for users of Looker Studio, especially those new to data transformation. The instructor demonstrates real-world problem-solving, such as fixing data type issues and creating calculated metrics. The argumentation is solid, based on live demonstrations and direct responses to student queries, which reinforces the credibility of the methods shown. However, the value is limited to a specific tool and may not be generalizable to other platforms.
Scientific Rigor, Source Quality, Title Accuracy
The scientific rigor is moderate; the instructor relies on practical experience rather than citing external sources. The quality of sources is acceptable for a tutorial, as the primary source is the instructor’s expertise. The title accurately describes the content, focusing on intermediate visualizations and data transformation. No external references are provided, which is typical for such tutorials.
143 words
Title / Content Match
The title accurately reflects the content, which focuses on intermediate visualizations and data transformation in Looker Studio.
Quality & Reliability
7/10
The video is a practical tutorial with live demonstrations and direct interaction with students. The instructor explains concepts clearly and addresses questions, but there is no formal citation of sources or verification of claims. The content is based on the instructor's expertise and experience with Looker Studio.
Key Moments
Markers derived by PSI from the transcript: the creator did not define chapters.
- Introduction and class logistics
- Explanation of Looker Studio and its uses
- Sharing the Google Sheets dataset and creating a copy
- Connecting Looker Studio to the dataset
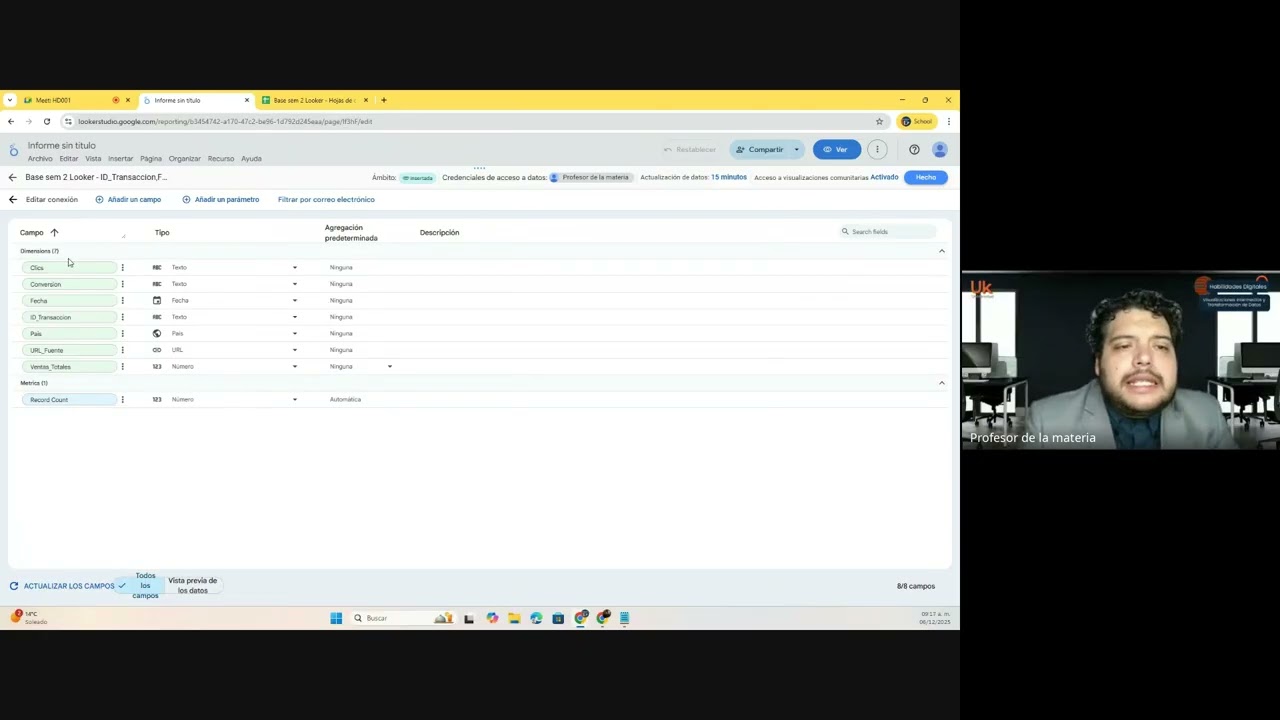
- Managing data sources and changing field types
- Creating a calculated field for conversion rate
- Troubleshooting formula errors and data type issues
- Discussion on rounding and formatting precision
- Applying custom formatting to the calculated field
- Wrap-up and next steps
Contribution & Novelties
The video offers a practical, step-by-step guide to transforming data in Looker Studio, specifically focusing on creating calculated fields and managing data types. It addresses common pitfalls such as text vs. numeric fields and rounding issues, providing solutions that are not always covered in official documentation. The interactive format with live Q&A adds value by clarifying real-world problems.
Pour aller plus loin :
- Looker Studio Help Center — Official documentation for Looker Studio, including guides on calculated fields and data sources.
- Google Sheets Functions — Reference for Google Sheets functions, useful for understanding data preparation.
- SQL for Data Analysis — Tutorial on SQL, which is the basis for Looker Studio’s calculated fields.
112 words
Radar Profile
The radar profile shows a balanced performance across all dimensions, with slightly higher scores in information quantity and quality, reflecting the tutorial's practical depth. The technical level is moderate, suitable for beginners, and reliability is solid due to the instructor's expertise.