Compartir y colaborar con Google Sheets
Keywords
Summary
133 words
Critical Evaluation
Value of the Information & Strength of the Argument
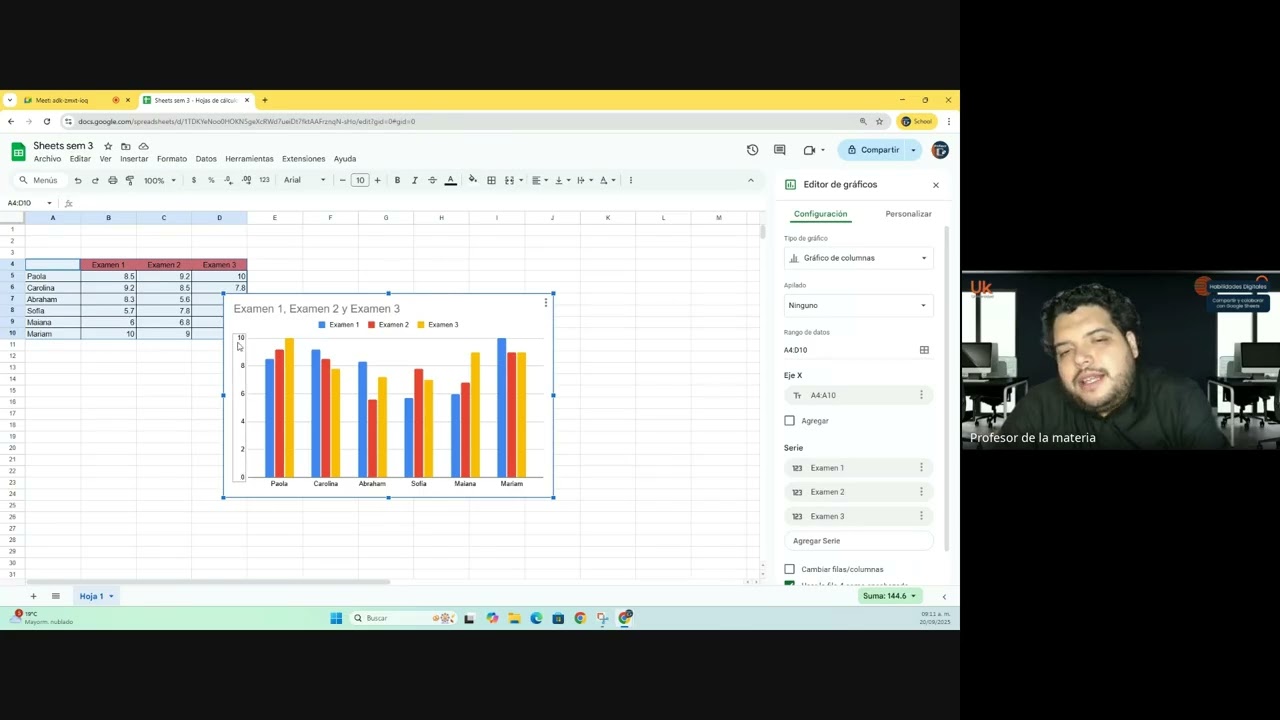
The video provides practical value for beginners learning to create and customize charts in Google Sheets. The instructor demonstrates the process clearly, showing how to select data, choose chart types, and use the customization options. He explains the reasoning behind choosing certain chart types based on data distribution, which adds educational value. However, the argumentation is mostly anecdotal and based on personal experience rather than systematic analysis. The discussion on error bars is informative but tangential to the main topic, and the collaboration aspect is only briefly mentioned without detailed demonstration.
100 words
Title / Content Match
The title 'Compartir y colaborar con Google Sheets' is partially accurate; the video focuses on chart creation and briefly touches on collaboration, but the collaboration aspect is not deeply explored.
Quality & Reliability
6/10
The video is a practical tutorial on Google Sheets chart creation and collaboration. It is based on the instructor's direct experience and demonstration, with no citations to external sources. The content is accurate and reliable for the basic features covered, but lacks depth and scientific rigor.
Key Moments
Markers derived by PSI from the transcript: the creator did not define chapters.
Contribution & Novelties
The video offers a practical, step-by-step guide to creating and customizing charts in Google Sheets, which is useful for beginners. It clarifies the importance of choosing appropriate chart types based on data and explains error bars in a relatable way. However, it does not introduce novel concepts or advanced techniques.
Pour aller plus loin :
- Google Sheets Help Center — Official documentation on charts and graphs.
- Data Visualization: A Practical Introduction — Book on data visualization principles.
- Error bar - Wikipedia — Overview of error bars and their use in scientific plots.
92 words
Radar Profile
The radar profile shows moderate scores across all dimensions, with a slightly higher score in quality of information and reliability, indicating a balanced but not exceptional tutorial. The low quantity of information and technical level suggest it is introductory.