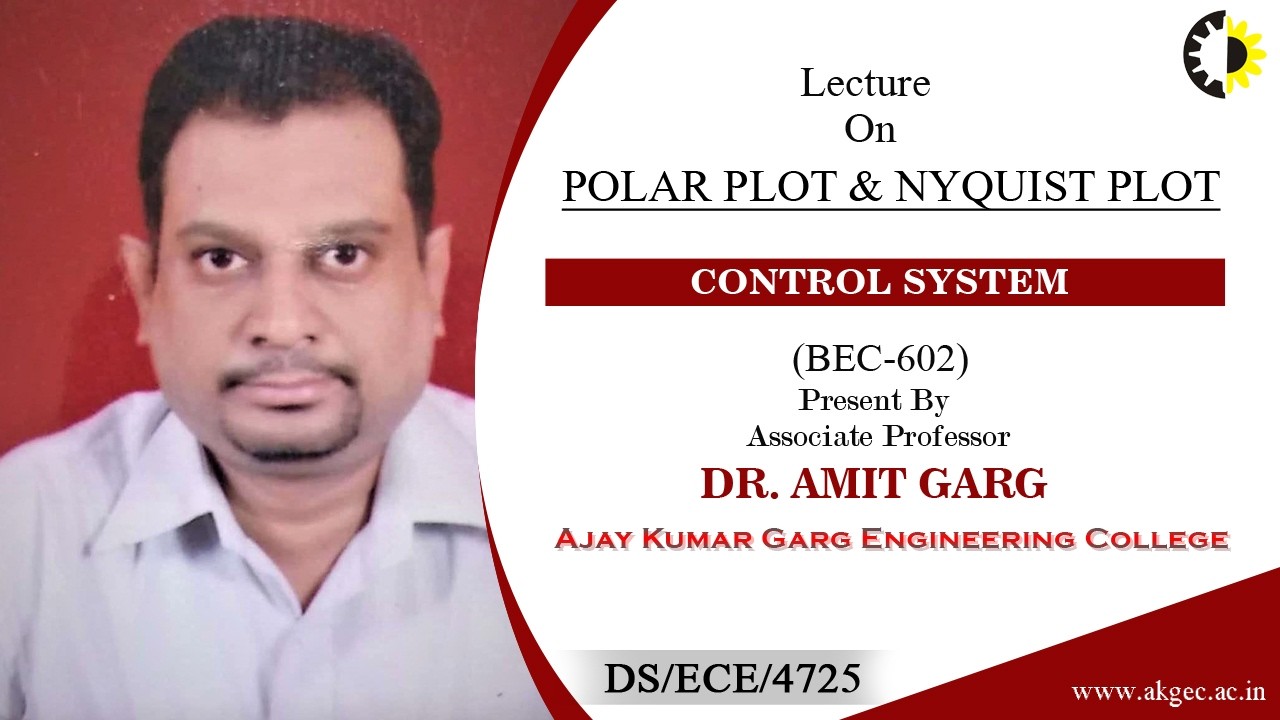
POLAR PLOT & NYQUIST PLOT | CONTROL SYSTEM | LECTURE 01 BY DR. AMIT GARG | AKGEC
Keywords
Summary
119 words
Critical Evaluation
Value of the Information & Strength of the Argument
The lecture provides a solid introduction to polar and Nyquist plots, with clear step-by-step derivations and numerical examples. The argumentation is logical, progressing from basic concepts to stability analysis. The value lies in its pedagogical approach, making complex topics accessible to engineering students. However, the presentation is informal and lacks depth in some theoretical justifications, such as the Nyquist stability criterion’s derivation.
Scientific Rigor, Source Quality, Title Accuracy
The lecture does not cite external sources, relying instead on standard textbook material. The title accurately reflects the content. The presentation is methodical but not highly rigorous, with some verbal slips and informal language. No comments were provided for analysis.
117 words
Title / Content Match
The title accurately reflects the content, which is a lecture on polar and Nyquist plots in control systems.
Quality & Reliability
6/10
The lecture provides a clear, step-by-step explanation of polar and Nyquist plots, including numerical examples and stability analysis. However, it lacks formal citations, and the presentation is informal with some verbal slips. The content is accurate but not deeply rigorous.
Key Moments
Markers derived by PSI from the transcript: the creator did not define chapters.
- Introduction to the lecture and topic overview.
- Explanation of polar plot and its advantages over Bode plot.
- First example: polar plot of a type-0 system.
- Second example: polar plot of a type-1 system and calculation of gain margin and phase margin.
- Introduction to Nyquist plot and Nyquist stability criterion.
- Numerical example: sketching Nyquist plot and determining stability range for K.
- Conclusion and references.
Cited Sources
- AKGEC Official Website — Institution providing the lecture.
- Control System Playlist — Related lectures on control systems.
Concurring Sources
- Control Systems Engineering by Norman Nise — Standard textbook covering polar and Nyquist plots.
Contribution & Novelties
The lecture provides a clear, step-by-step tutorial on polar and Nyquist plots, which is valuable for students. It demonstrates the construction of these plots and their use in stability analysis, including gain and phase margin calculations. The numerical examples help reinforce the concepts.
Pour aller plus loin :
- Nyquist stability criterion — Provides a detailed explanation of the criterion used in the lecture.
- Polar plot (control theory) — Offers additional context on polar plots in control systems.
- Bode plot — Related frequency response technique mentioned in the lecture.
88 words
Radar Profile
The radar profile shows a balanced performance across all dimensions, with slightly higher scores in technical level and information quantity, indicating a solid educational content with room for improvement in source rigor and presentation polish.