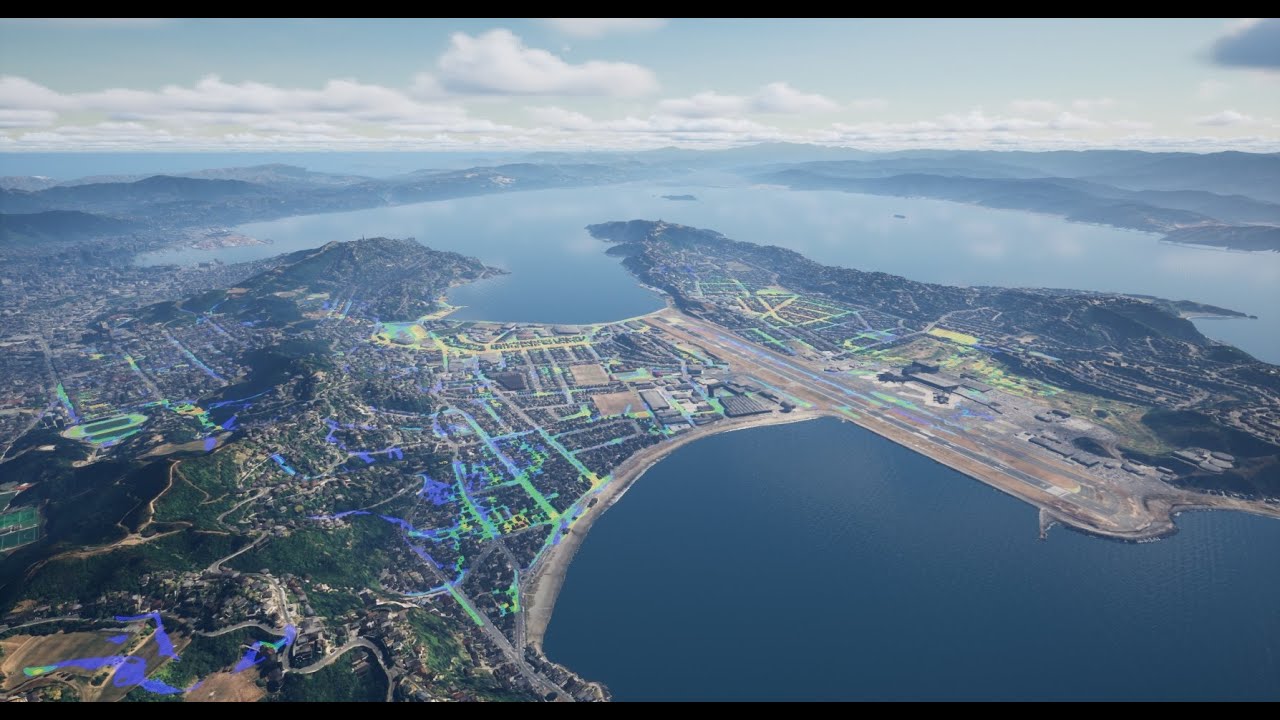
Transforming Climate Data into Experience | Jeff Jones | NZGDC 2025
Keywords
Summary
133 words
Critical Evaluation
Value of the Information & Strength of the Argument
The talk provides valuable insights into the practical application of game engine technology for civic engagement. The argumentation is solid, based on real project experience and specific technical details. The speakers effectively demonstrate how immersive experiences can make complex climate data more accessible and emotionally resonant. They also honestly discuss challenges and limitations, which strengthens the credibility of their claims.
Scientific Rigor, Source Quality, Title Accuracy
The talk is a first-hand account from the project leads, so the information is primary and reliable. They reference specific tools (Unreal Engine, ArcGIS, City Engine, Datasmith, Logic Driver) and data sources (NIWA, Wellington Water, GIS team) without providing external citations. The title accurately reflects the content, and the presentation is well-structured and technically detailed.
130 words
Title / Content Match
The title accurately reflects the content: the talk focuses on transforming climate data into an immersive experience, with a strong emphasis on the technical and design process.
Quality & Reliability
8/10
The talk is a detailed technical presentation by practitioners directly involved in the project, with concrete implementation details and lessons learned. The information is credible and grounded in real experience, though it is primarily anecdotal and lacks external verification.
Key Moments
Markers derived by PSI from the transcript: the creator did not define chapters.
Cited Sources
- Bloomberg Global Mayors Challenge — Funding source for the project
- NIWA — Climate data provider
- Wellington Water — Data provider for water-related climate impacts
- Wellington City Council GIS team — Internal data provider
- Unreal Engine — Game engine used for the experience
- ArcGIS — GIS software used for data processing
- City Engine — 3D city modeling software
- Datasmith — Unreal Engine plugin for importing 3D data
- Logic Driver — Third-party state machine plugin for Unreal Engine
Concurring Sources
- Unreal Engine documentation — Official documentation for the engine used
- ArcGIS documentation — Documentation for GIS software used
Contribution & Novelties
The talk provides a detailed case study of using a digital twin and game engine technology to communicate climate change impacts to the public. It offers practical insights into the technical implementation, including terrain morphing, GIS data integration, and state machine design. The emphasis on integrating indigenous knowledge (mātauranga Māori) adds a unique perspective.
Pour aller plus loin :
- Digital twin — Concept of digital replicas of physical systems.
- Geographic information system — Technology used for spatial data.
- Unreal Engine — Game engine used in the project.
- Climate change adaptation — Strategies for responding to climate impacts.
97 words
Radar Profile
The radar profile shows high scores in information quantity, quality, and technical level, with a slightly lower reliability score due to the anecdotal nature of the presentation. The overall shape indicates a technically rich and informative talk, but with some limitations in external verification.
💬 No comments were provided for analysis.