Leçon 8: Les scénarios et les indicateurs
Keywords
Summary
189 words
Critical Evaluation
Value of the Information & Strength of the Argument
The video provides valuable insights into the methodology of energy scenario analysis, demonstrating how multiple indicators (energy, electricity, renewables, CO2, waste, costs) can be used to evaluate a national energy strategy. The argumentation is systematic and data-driven, using the Energyscope calculator to visualize comparisons. The presenter clearly explains the assumptions and limitations, such as the exclusion of certain costs and the need for expert review. The approach is transparent, with references to a wiki for detailed assumptions. However, the video does not delve into alternative scenarios or critically assess the NPE scenario’s feasibility, which would strengthen the argumentation.
Scientific Rigor, Source Quality, Title Accuracy
The scientific rigor is moderate: the video is based on a well-established tool (Energyscope) and presents data in a structured manner, but it lacks explicit citations to peer-reviewed literature or detailed data sources. The quality of sources is acceptable for an educational context, with the wiki providing transparency. The title accurately reflects the content, which focuses on scenarios and indicators. The video is part of a series, suggesting a structured educational approach. However, the lack of external references and the presenter’s own admission of cost estimation uncertainties limit the overall rigor.
204 words
Title / Content Match
The title accurately reflects the content, which focuses on scenarios and indicators for Swiss energy policy.
Quality & Reliability
7/10
The video is an educational tutorial from an academic institution (EPFL) presenting a scenario analysis tool. It clearly states assumptions and refers to a wiki for transparency, but lacks detailed citations and peer-reviewed sources.
Key Moments
Markers derived by PSI from the transcript: the creator did not define chapters.
- Introduction to the lesson and recap of previous comparison of final energy consumption.
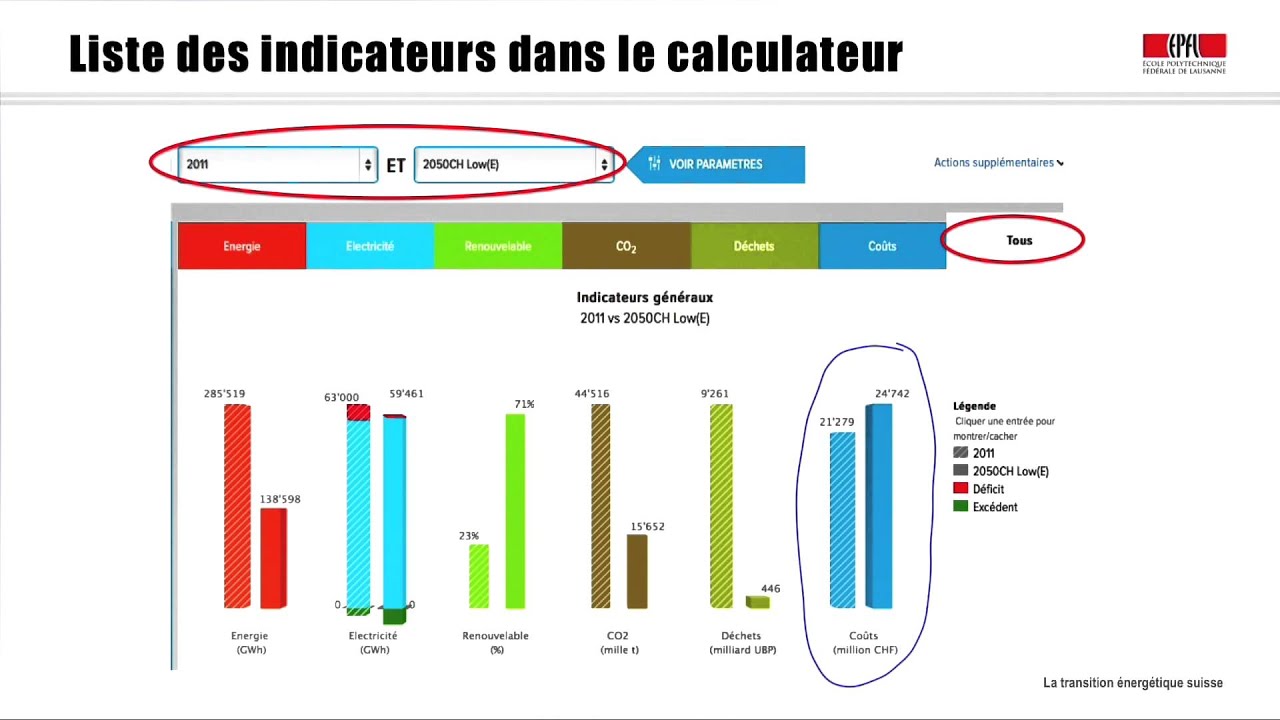
- Presentation of the six indicators to be analyzed: energy, electricity, renewables, CO2, waste, and costs.
- Analysis of final energy indicator: substantial reduction in 2050.
- Analysis of electricity indicator: shift from imports to exports in 2050.
- Analysis of renewable share: increase from 23% to 71%.
- Analysis of CO2 emissions: reduction from 44.5 million to 16 million tonnes.
- Analysis of waste indicator: significant reduction in long-lived waste due to nuclear phase-out.
- Analysis of costs: increase from 21 to 25 billion CHF, with caveats.
- Detailed breakdown of the 2050 energy mix, starting with fossil fuels.
- Detailed breakdown of renewable energy sources in 2050.
- Analysis of CO2 emissions by sector and monthly variations.
- Analysis of waste types, including nuclear and imported electricity.
- Conclusion summarizing the benefits of the scenario and noting cost uncertainties.
Cited Sources
- Energyscope Wiki — Mentioned as the source for detailed assumptions used in the calculator.
Concurring Sources
- Swiss Federal Office of Energy - Energy Strategy 2050 — The video's scenario is based on the Swiss Federal Council's New Energy Policy, which is part of the Energy Strategy 2050.
Contribution & Novelties
The video provides a clear, step-by-step demonstration of how to use the Energyscope calculator to evaluate energy scenarios, making complex energy modeling accessible to a broader audience. It emphasizes the importance of considering multiple indicators beyond just energy consumption, such as CO2 emissions, waste, and costs, which is crucial for informed policy decisions. The transparency about assumptions and limitations is a notable strength.
Pour aller plus loin :
- Swiss Energy Strategy 2050 — Official Swiss government page on the Energy Strategy 2050, providing context for the scenario.
- Life-cycle assessment — Relevant for understanding the methodology behind CO2 and waste indicators.
- Energy modeling — Overview of energy modeling approaches, relevant to the scenario analysis.
113 words
Radar Profile
The radar profile shows balanced scores across information quantity, quality, technical level, and reliability, with slightly lower technical level due to the introductory nature. The video is a solid educational resource, but not highly technical or research-intensive.