Lektion 8: Die Szenarien: Indikatoren
Keywords
Summary
153 words
Critical Evaluation
Value of the Information & Strength of the Argument
The video provides a valuable overview of the key indicators used to assess energy scenarios, making complex data accessible. It clearly explains the assumptions behind the scenarios and the implications for Switzerland’s energy future. The argumentation is logical and well-structured, systematically walking through each indicator and its projected changes. However, the video does not delve into the uncertainties or limitations of the model, and it presents the scenarios as projections without discussing potential criticisms or alternative viewpoints. The reliance on the Swiss-Energyscope model, which is a legitimate tool, adds credibility, but the lack of external references weakens the overall argumentation.
Scientific Rigor, Source Quality, Title Accuracy
The video is scientifically grounded in the Swiss-Energyscope project, which is a recognized research initiative. However, it does not cite specific sources within the video, and the description provides no links. The title accurately reflects the content, focusing on indicators for energy scenarios. The video’s rigor is moderate: it explains the methodology and assumptions, but it does not provide detailed references or discuss potential biases. The presentation is clear and educational, but for a more rigorous scientific analysis, additional sources and critical discussion would be needed.
201 words
Title / Content Match
The title accurately reflects the content, as the video focuses on indicators used to evaluate energy scenarios.
Quality & Reliability
7/10
The video is an educational tutorial from a Swiss research project (Swiss-Energyscope) presenting energy scenarios and indicators. It is based on the Swiss EnergyScope model, which is a well-established tool. The content is clear and structured, but it lacks explicit citations to peer-reviewed sources within the video itself. The assumptions and methods are explained, but the scientific rigor is moderate due to the absence of detailed references.
Key Moments
Markers derived by PSI from the transcript: the creator did not define chapters.
- Introduction to the lesson and overview of indicators.
- Comparison of final energy consumption between 2011 and 2050.
- Discussion of electricity consumption and seasonal deficits/surpluses.
- Renewable energy share increase from 18% to 71%.
- CO2 emissions reduction from 45 million to 16 million tonnes.
- Waste generation and the phase-out of nuclear waste.
- Costs of the energy system and their increase.
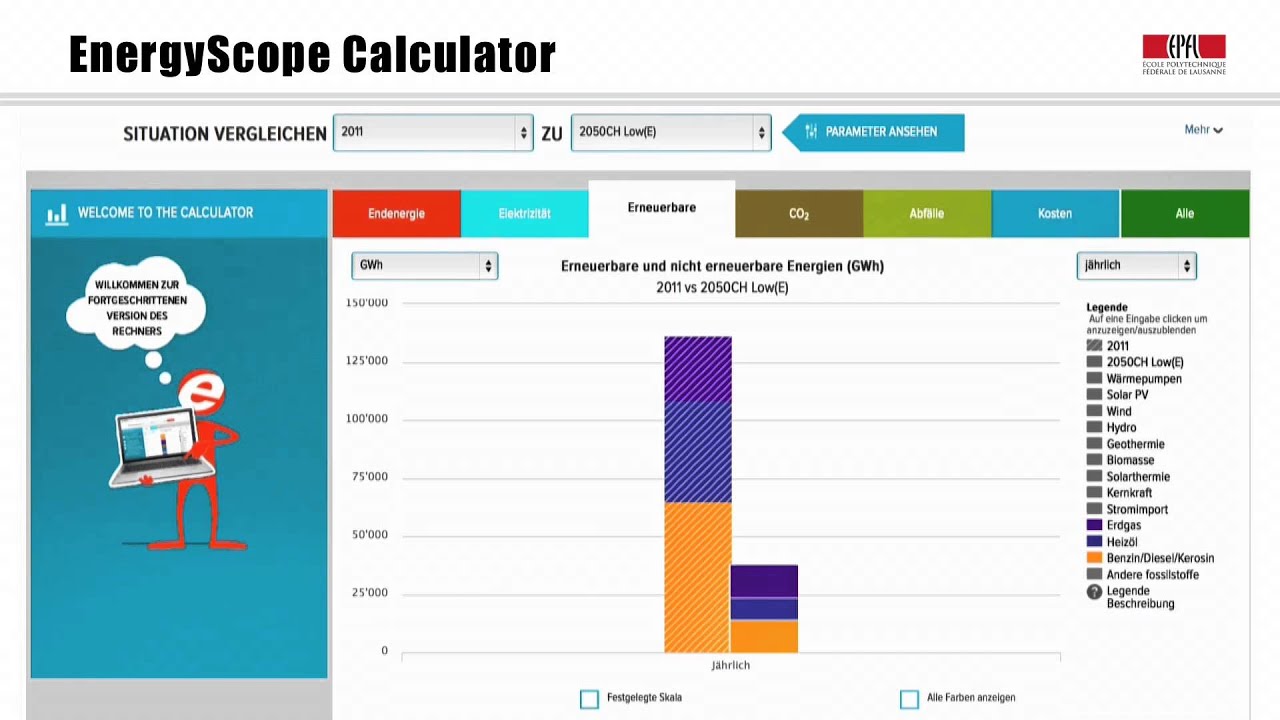
- Demonstration of the Swiss-Energyscope calculator with fossil fuels.
- Adding renewable energy sources to the calculator.
- Analysis of CO2 emissions by source and monthly variations.
Contribution & Novelties
The video provides a clear and structured introduction to the indicators used in Swiss energy scenarios, making complex data accessible to a broader audience. It demonstrates the use of the Swiss-Energyscope calculator, which is a valuable tool for exploring energy scenarios. The novelty lies in its pedagogical approach, breaking down each indicator and showing how they interrelate.
Pour aller plus loin :
- Swiss-Energyscope — Official website of the project, providing access to the calculator and further documentation.
- Energy policy of Switzerland — Overview of Switzerland’s energy policy and its goals.
- Swiss Federal Office of Energy — Official government body responsible for energy policy, with reports and data.
- Intergovernmental Panel on Climate Change (IPCC) — International body assessing climate change science, relevant for understanding CO2 emissions and scenarios.
127 words
Radar Profile
The radar profile shows a balanced performance across all dimensions, with slightly higher scores in information quantity and quality, and lower in technical level. This indicates that the video is informative and reliable, but not highly technical, making it suitable for a general audience.