UofM - MATH 2740 - Lecture 17 - Part 1 - Graph theory (Introduction to RMarkdown)
Keywords
Summary
152 words
Critical Evaluation
Value of the Information & Strength of the Argument
The video provides valuable practical knowledge on using R Markdown for data analysis and reporting. The instructor demonstrates real-world applications, such as generating COVID-19 reports, which adds credibility. The argumentation is clear and logical, with step-by-step explanations. However, the content is more tutorial-like than scientific, and the instructor’s personal opinions (e.g., preference for Jupyter) are presented without deep justification.
Scientific Rigor, Source Quality, Title Accuracy
The video is a tutorial, so it does not cite formal scientific sources. The instructor mentions the Tidyverse and its packages, but no specific references are provided. The title accurately reflects the content, which is an introduction to R Markdown within a graph theory course. The video is part of a lecture series, and the instructor’s expertise is implied by his position at a university.
139 words
Title / Content Match
The title accurately reflects the content: it introduces R Markdown in the context of graph theory, as part of a lecture series.
Quality & Reliability
7/10
The video is a tutorial on R Markdown within a graph theory course. The content is accurate and practical, but it is not a formal scientific study. The instructor demonstrates real-world applications and provides code examples. The quality is good for an educational context, but lacks formal citations.
Key Moments
Markers derived by PSI from the transcript: the creator did not define chapters.
- Introduction to R Markdown and its purpose.
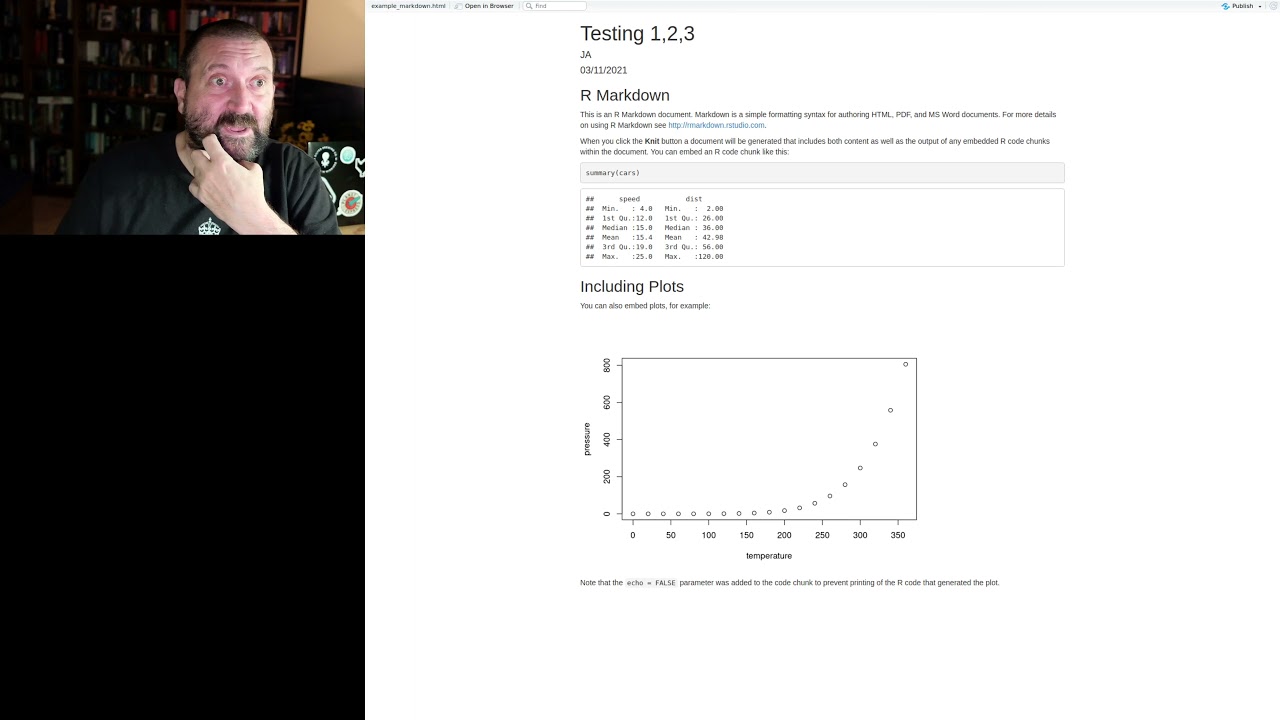
- Creating an R Markdown file in RStudio.
- Embedding code chunks and inline R code.
- Compiling R Markdown to HTML and PDF.
- Using the Tidyverse for data wrangling.
- Applying filters to the Twitch dataset.
- Creating a graph object and checking connectivity.
- Suppressing output and customizing document appearance.
- Real-world example: COVID-19 reports generated with R Markdown.
Contribution & Novelties
This video provides a practical introduction to R Markdown, emphasizing its utility for creating dynamic reports in a research context. It demonstrates the integration of R code with text, which is valuable for reproducible research. The example of generating COVID-19 reports illustrates a real-world application.
Pour aller plus loin :
- R Markdown: The Definitive Guide — Comprehensive reference for R Markdown.
- Tidyverse — Collection of R packages for data science.
- igraph — R package for network analysis, used in the video.
81 words
Radar Profile
The radar profile shows moderate scores across all dimensions, with slightly higher scores in information quantity and quality, reflecting the tutorial's practical content. The technical level is moderate, suitable for students with some R experience.