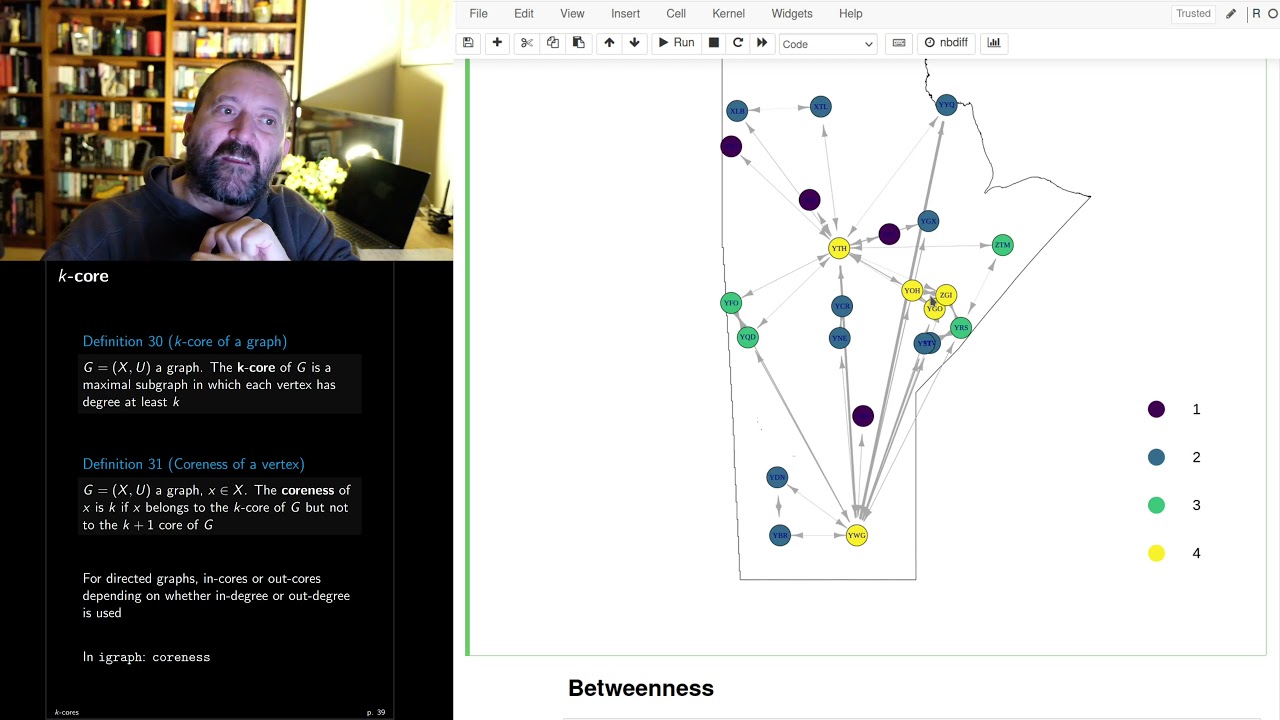
UofM - MATH 2740 - Lecture 21 - Part 1 - Graph theory (Air transport in MB)
Keywords
Summary
121 words
Critical Evaluation
Value of the Information & Strength of the Argument
The lecture provides valuable hands-on instruction for applying graph theory concepts to real-world data. The instructor clearly explains the definitions and interpretations of each metric, and demonstrates their computation in R. The argumentation is solid, as he uses the specific example of the Manitoba air transport network to illustrate how different metrics reveal different aspects of network structure. He also critically discusses the influence of data preprocessing choices, such as aggregating external nodes, on the results. The presentation is logical and builds on previous lectures, making it a useful resource for students learning network analysis.
Scientific Rigor, Source Quality, Title Accuracy
The lecture is scientifically rigorous in its use of established graph theory concepts and the igraph package. The instructor does not cite external sources, but the content is based on standard definitions and methods. The title accurately describes the content, and the lecture is well-structured. The instructor’s explanations are clear and he acknowledges limitations and areas for further thought, such as the interpretation of weighted closeness. Overall, the scientific quality is high for an educational context.
186 words
Title / Content Match
The title accurately reflects the content: a lecture on graph theory applied to air transport in Manitoba.
Quality & Reliability
7/10
The lecture is a technical tutorial on graph analysis using R and igraph, with clear explanations and reproducible code. The content is accurate and well-structured, but it is a university lecture, not peer-reviewed research, and relies on the instructor's expertise.
Key Moments
Markers derived by PSI from the transcript: the creator did not define chapters.
- Introduction and recap of previous lecture on k-nearest neighbors.
- Explanation of average nearest neighbor degree and its computation in R.
- Plotting the k-nearest neighbors with color coding.
- Introduction to k-core decomposition and its computation.
- Plotting the k-core values on the network.
- Discussion of betweenness centrality and its computation.
- Plotting betweenness centrality and handling zero values.
- Introduction to closeness centrality and its weighted version.
- Comparison of unweighted and weighted closeness plots.
- Including the 'rest of the world' node and observing changes in closeness.
Contribution & Novelties
The lecture provides a practical, code-based demonstration of graph metrics on a real-world network, which is valuable for students. It highlights the importance of edge weights and data aggregation choices in network analysis. The ‘Pour aller plus loin’ section suggests further exploration of related concepts.
Pour aller plus loin :
- igraph R package documentation — Official documentation for the igraph package used in the lecture.
- Network Analysis in R — A tutorial on network analysis in R, covering similar concepts.
- Centrality measures on Wikipedia — Overview of centrality measures including betweenness and closeness.
93 words
Radar Profile
The radar profile shows high scores in information quantity, quality, and technical level, with a slightly lower but still good reliability score. This indicates a technically rich and informative lecture, but with some limitations in terms of external validation.