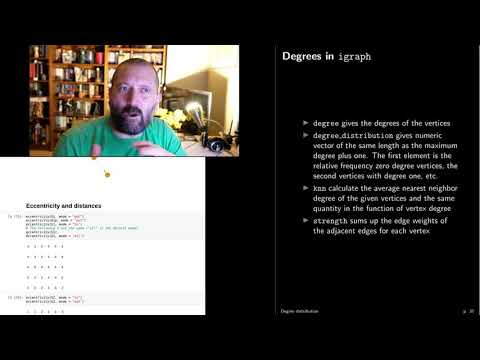
UofM - MATH 2740 - Lecture 19 - Graph theory (Graph measures 3)
Keywords
Summary
165 words
Critical Evaluation
Value of the Information & Strength of the Argument
The lecture provides a solid introduction to key graph measures, with clear definitions and intuitive explanations. The use of a consistent example graph helps in understanding the concepts. The instructor takes time to explain the rationale behind each measure, such as why k-core indicates well-connected subgraphs and how betweenness centrality captures the role of a vertex in information flow. The argumentation is logical and builds on previous lectures, though some parts are presented in a somewhat informal manner. The practical R demonstrations add value by showing how to compute these measures, which is useful for students.
Scientific Rigor, Source Quality, Title Accuracy
The lecture is mathematically rigorous, with standard definitions and correct usage of terminology. However, no external sources are cited, and the content relies on the instructor’s expertise. The title accurately reflects the content, as it is a lecture on graph measures. The video is a raw recording with no editing, which may affect presentation quality but not the scientific content. The instructor occasionally digresses, but these do not detract from the overall accuracy.
184 words
Title / Content Match
The title accurately reflects the content: a lecture on graph measures, specifically covering degree, k-core, and centrality measures.
Quality & Reliability
7/10
Lecture content is mathematically sound, definitions are standard, and the use of R for illustration is appropriate. However, the video is a raw lecture recording with no citations or references, and the presentation is informal with some digressions.
Key Moments
Markers derived by PSI from the transcript: the creator did not define chapters.
- Introduction and setup
- Computing degrees from adjacency matrix
- Degree distribution and average neighbor degree
- Introduction to k-core and corness
- Example of k-core computation in R
- Introduction to vertex centrality
- Betweenness centrality definition and example
- Closeness centrality and R demonstration
- Summary and next steps
Contribution & Novelties
The lecture provides a clear pedagogical explanation of graph measures, particularly k-core and centrality, with practical R implementations. It bridges theoretical definitions and computational application, which is valuable for students. The emphasis on directed graphs and the distinction between in/out measures is a useful nuance.
Pour aller plus loin :
- Betweenness centrality - Wikipedia — Provides a comprehensive overview and algorithmic details.
- Closeness centrality - Wikipedia — Explains the concept and its variants.
- igraph R package documentation — Official documentation for the R package used in the lecture, including functions for centrality and k-core.
94 words
Radar Profile
The radar profile shows high scores in information quantity and technical level, indicating a content-rich lecture with moderate depth. The quality and reliability scores are slightly lower, reflecting the lack of citations and informal presentation. Overall, the lecture is a solid educational resource for graph theory.