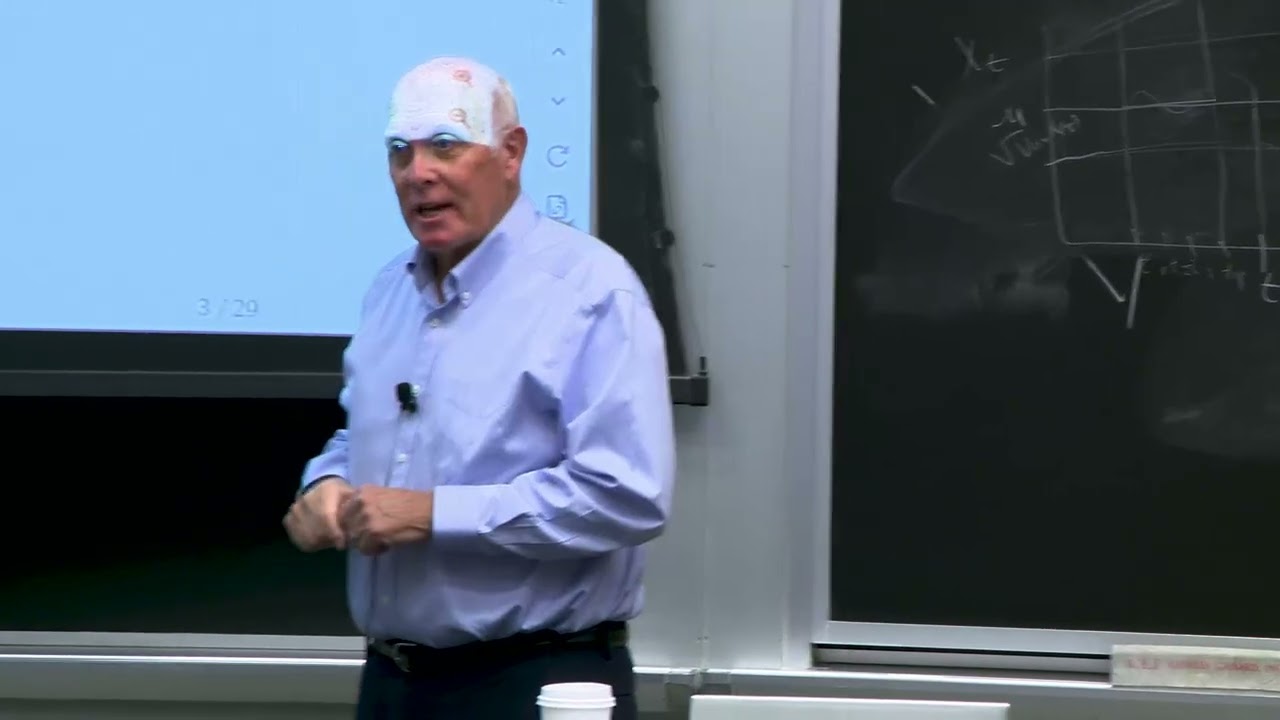
Lecture 12: Time Series Analysis
Keywords
Summary
182 words
Critical Evaluation
The lecture provides a solid introduction to time series analysis, with a clear pedagogical structure. The instructor, Peter Kempthorne, is a professor at MIT, and the content is part of a formal course, lending credibility. The mathematical definitions of stationarity and autocorrelation are precise and well-explained. The use of real financial data (S&P 500, Amazon, crude oil, Treasury yields) effectively illustrates the concepts and their practical relevance. The lecture correctly emphasizes the importance of transforming non-stationary series to achieve stationarity, which is a fundamental step in time series modeling. The observation of leptokurtosis in returns is accurate and motivates the need for more sophisticated models. The presentation of the sample autocorrelation function is clear, though the lecture does not delve into hypothesis testing or confidence intervals in detail. The content is rigorous but accessible, with a good balance between theory and application. The sources are not explicitly cited within the lecture, but the course materials and OCW resources are referenced in the description. The lecture is part of a broader course, so it assumes some prior knowledge of statistics and probability, but it is still understandable for advanced undergraduates. Overall, the lecture is of high quality, with minor limitations in depth and lack of explicit citations.
206 words
Title / Content Match
The title accurately reflects the content, which is a lecture on time series analysis with applications in finance.
Quality & Reliability
9/10
Lecture by MIT professor, part of an accredited course, with clear mathematical derivations and real-world financial examples. The content is rigorous and well-structured, though it is an introductory lecture and not a comprehensive treatment.
Key Moments
Markers derived by PSI from the transcript: the creator did not define chapters.
- Introduction to time series analysis and its importance in finance.
- Definition of stochastic processes and strict stationarity.
- Explanation of covariance stationarity and autocorrelation function.
- Analysis of S&P 500 index and transformation to log returns.
- Discussion of leptokurtosis in financial returns.
- Examination of Amazon stock and crude oil futures.
- Introduction to random walk model and sample autocorrelation function.
- Preview of AR, MA, and ARMA models.
Cited Sources
- MIT OpenCourseWare — Course materials and resources.
- Course page — Full course information and materials.
- YouTube Playlist — Playlist of lectures for the course.
- OCW Terms — Terms of use for OCW content.
- OCW Comments Policy — Guidelines for comments on OCW platforms.
Concurring Sources
- MIT OpenCourseWare — Official course materials and resources.
External References
Contribution & Novelties
The lecture provides a clear and accessible introduction to time series analysis, emphasizing practical applications in finance. It effectively demonstrates the transformation of non-stationary financial data to stationarity via log returns, and highlights the presence of leptokurtosis and volatility clustering. The lecture sets the foundation for understanding ARMA models.
Pour aller plus loin :
- Autoregressive moving average model — Overview of ARMA models.
- Wold’s theorem — Theoretical basis for ARMA representation.
- Box–Jenkins method — Methodology for model selection and estimation.
80 words
Radar Profile
The radar profile shows high scores in quality and reliability, with slightly lower scores in quantity and technical depth, reflecting the introductory nature of the lecture.