Quantitative Genetics, Heritability, and Variances
Keywords
Summary
149 words
Critical Evaluation
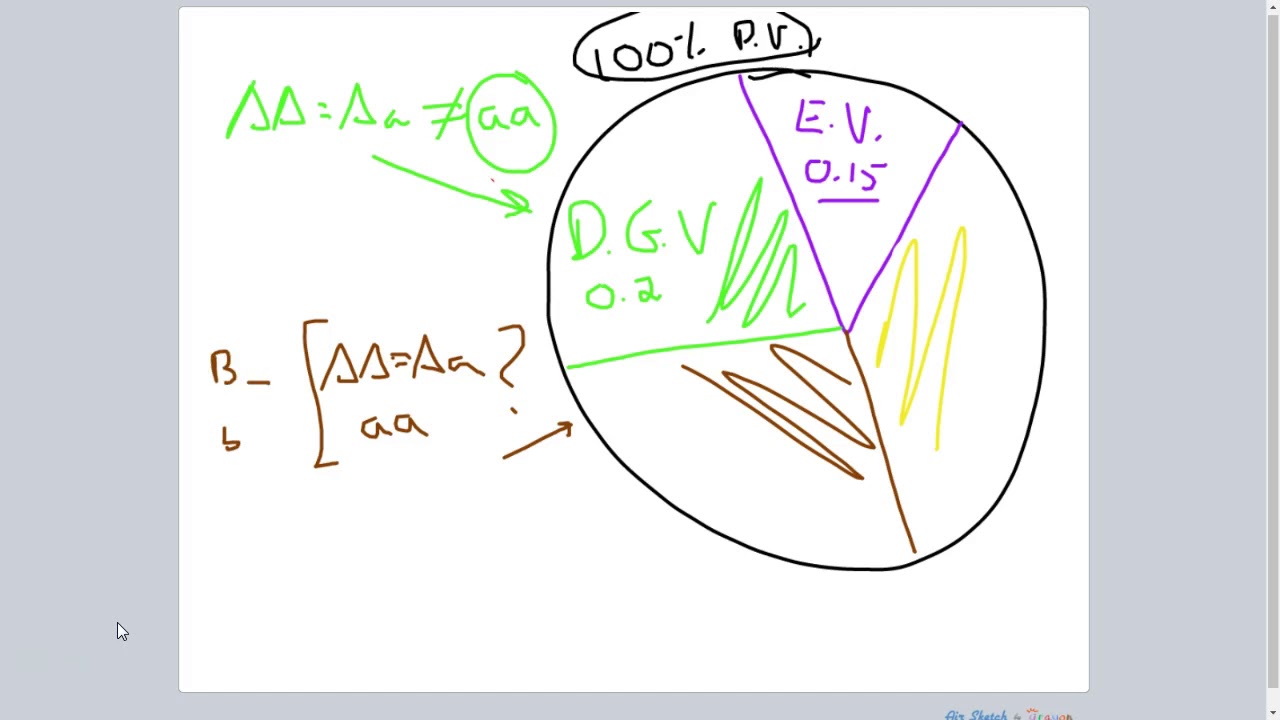
The video offers a solid introductory overview of quantitative genetics, effectively using a pie chart analogy to decompose phenotypic variance into environmental and genetic components. The explanation is clear and accessible, making it suitable for students or enthusiasts new to the topic. The breakdown of genetic variance into dominance, epistatic, and additive components is accurate and aligns with standard genetics textbooks. However, the video lacks depth in several areas. It does not discuss the mathematical formulations or statistical methods used to estimate these variances, such as ANOVA or maximum likelihood approaches. The arbitrary numerical values used in the example are not based on real data, which could mislead viewers into thinking these proportions are typical. The video also simplifies the concept of heritability, not fully addressing the complexities of estimating it in natural populations or the influence of gene-environment interactions. The absence of citations to primary literature or even popular science sources reduces its scientific rigor. The presentation is engaging, with clear visuals and a logical flow, but the lack of references and the oversimplification of certain concepts limit its value for advanced learners. The title accurately reflects the content, and the video fulfills its stated aim of clarifying the principles, but it could benefit from more nuanced discussion and real-world examples.
212 words
Title / Content Match
The title accurately reflects the content, which covers quantitative genetics, heritability, and variance components.
Quality & Reliability
7/10
The video provides a clear and structured explanation of quantitative genetics concepts, using a pie chart analogy to decompose phenotypic variance. The content is accurate and aligns with standard genetics textbooks, though it lacks citations to primary literature and simplifies some complexities.
Key Moments
Markers derived by PSI from the transcript: the creator did not define chapters.
- Introduction to quantitative genetics and phenotypic variance
- Explanation of phenotypic variance using height as an example
- Introduction of the pie chart model for phenotypic variance
- Discussion of environmental variance and its contribution
- Breakdown of genetic variance into dominance, epistatic, and additive components
- Explanation of dominance genetic variance
- Explanation of genic interaction variance (epistasis)
- Explanation of additive genetic variance
- Introduction to heritability and its types
- Example of breeding programs and heritability interpretation
Contribution & Novelties
The video provides a clear pedagogical breakdown of phenotypic variance into environmental and genetic components, with a useful pie chart analogy. It clarifies the distinction between broad-sense and narrow-sense heritability, which is often confusing for students. The video’s contribution lies in its accessible explanation of variance decomposition, though it does not introduce new research.
Pour aller plus loin :
- Quantitative genetics - Wikipedia — Provides a comprehensive overview of the field, including variance components and heritability.
- Heritability - Wikipedia — Detailed explanation of heritability concepts, including broad and narrow sense.
- Additive genetic variance - Wikipedia — Specific information on additive genetic variance and its role in breeding.
107 words
Radar Profile
The radar profile shows moderate to high scores across all dimensions, with quality of information and reliability being the strongest, while technical level is slightly lower, indicating a balance between accessibility and scientific accuracy.