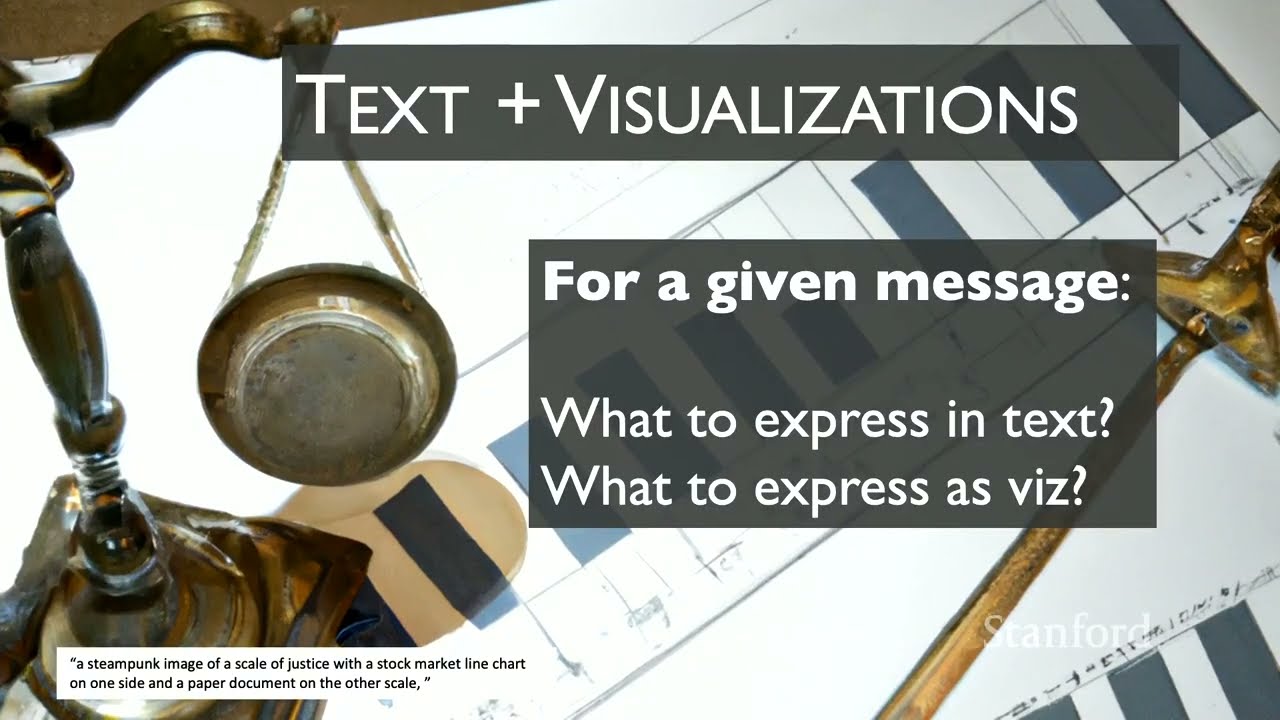
Stanford CS547 HCI Seminar | Spring 2026 | Show It or Tell It? Text, Visualization, and Combination
Keywords
Summary
164 words
Critical Evaluation
The seminar provides a comprehensive overview of research on the integration of text and visualization, drawing on both the speaker’s own studies and related work. Hearst effectively demonstrates the complexity of the interaction, showing that text can both enhance and override visual information depending on alignment and semantic level. The presentation is well-structured, moving from design considerations to cognitive underpinnings and future directions with LLMs. The speaker is transparent about her expertise boundaries, particularly in cognitive models and LLMs, which adds credibility. However, the talk is a high-level overview rather than a deep dive into any single study, and some claims, such as the preference for more text, are presented without full statistical details. The reliance on her own research and a few key papers limits the breadth of sources, but the references are relevant and credible. The discussion of cognitive models is speculative and based on a limited reading, which she acknowledges. The section on LLMs is timely but also exploratory. Overall, the talk offers valuable insights for HCI practitioners and researchers, though it leaves many open questions. The audience interaction and hand-raising exercises engage the viewers and illustrate the points effectively. The lack of a formal Q&A transcript limits the depth of discussion, but the content stands on its own. The talk does not address potential counterarguments or limitations of the studies in detail, which could be a weakness for a critical audience. Nonetheless, it is a thought-provoking and informative seminar that highlights the importance of text in visualization design.
252 words
Title / Content Match
The title accurately reflects the content, which explores the interplay between text and visualization in information presentation.
Quality & Reliability
8/10
Presentation by a renowned professor in HCI, based on published research and personal expertise. The talk is well-structured, references specific studies, and includes caveats about areas outside her expertise. However, it is a seminar talk, not a peer-reviewed publication, and some claims are presented without full methodological detail.
Key Moments
Markers derived by PSI from the transcript: the creator did not define chapters.
- Introduction and overview of the talk's structure.
- Definition of information visualization and Anscombe's quartet example.
- Discussion of the role of language in visualization, citing the 'Beyond Memorability' paper.
- Research on captions and visual salience, showing captions can override visual prominence.
- Lundgard and Sundararajan's work on text levels for accessibility, contrasting BLV and sighted preferences.
- Hearst's own study on text quantity, finding that more text is preferred.
- Study on predictions: text annotations do not influence predictions but signal author bias.
- Transition to cognitive models and potential explanations for the findings.
- Discussion of multimodal LLMs and their role in visualization.
- Conclusion and summary of key takeaways.
Cited Sources
- Stanford HCI Seminar — Seminar series page, likely containing schedule and related resources.
- Stanford Graduate Education — Information about Stanford's graduate programs, mentioned in the video description.
Concurring Sources
- Beyond Memorability: Visualization Recognition and Recall — Study cited in the talk showing that titles receive the most attention in charts.
Dissenting Sources
- Tufte's principles of data visualization — Tufte's minimalist approach contrasts with the finding that more text is preferred.
Contribution & Novelties
The talk synthesizes existing research and presents new findings from the speaker’s own studies, particularly on the quantity of text in charts and the influence of text on predictions and perceived bias. It challenges minimalist design principles and highlights the importance of text in visualization. The discussion of cognitive models and LLMs offers a forward-looking perspective, though these sections are more speculative.
Pour aller plus loin :
- Anscombe’s quartet — Classic example illustrating the importance of visualization.
- Information visualization — Overview of the field.
- Multimodal LLM — Background on multimodal models.
91 words
Radar Profile
The radar profile shows high scores in information quantity, quality, and reliability, with a slightly lower technical level, reflecting the talk's balance between research depth and accessibility. The overall high scores indicate a valuable and credible presentation.
💬 No comments were provided for analysis.