T-SNE: Example in Scikit-Learn
Keywords
Summary
147 words
Critical Evaluation
Value of the Information & Strength of the Argument
The video provides practical value by demonstrating how to use t-SNE in scikit-learn and how the perplexity parameter affects the resulting embedding. The argumentation is based on visual inspection of the plots, which is appropriate for a tutorial. However, the presenter does not provide quantitative metrics or a systematic comparison, and the reasoning is somewhat informal. The explanation of why certain patterns appear (e.g., gaps) is brief and not deeply justified. Overall, the value lies in the hands-on demonstration, but the argumentation could be strengthened with more rigorous analysis.
98 words
Title / Content Match
The title accurately reflects the content, which is a practical example of t-SNE in scikit-learn.
Quality & Reliability
7/10
The video provides a practical demonstration of t-SNE using scikit-learn, with clear explanations of the effect of perplexity on the embedding. It is based on standard library usage and does not introduce novel claims. The content is accurate but lacks in-depth theoretical grounding and references.
Key Moments
Markers derived by PSI from the transcript: the creator did not define chapters.
- Introduction and setup with Swiss roll dataset
- Building t-SNE model with perplexity 5
- Visualizing embedding with perplexity 5
- Increasing perplexity to 10 and observing changes
- Increasing perplexity to 20 and noting clumpiness reduction
- Increasing perplexity to 40 and achieving more convincing distribution
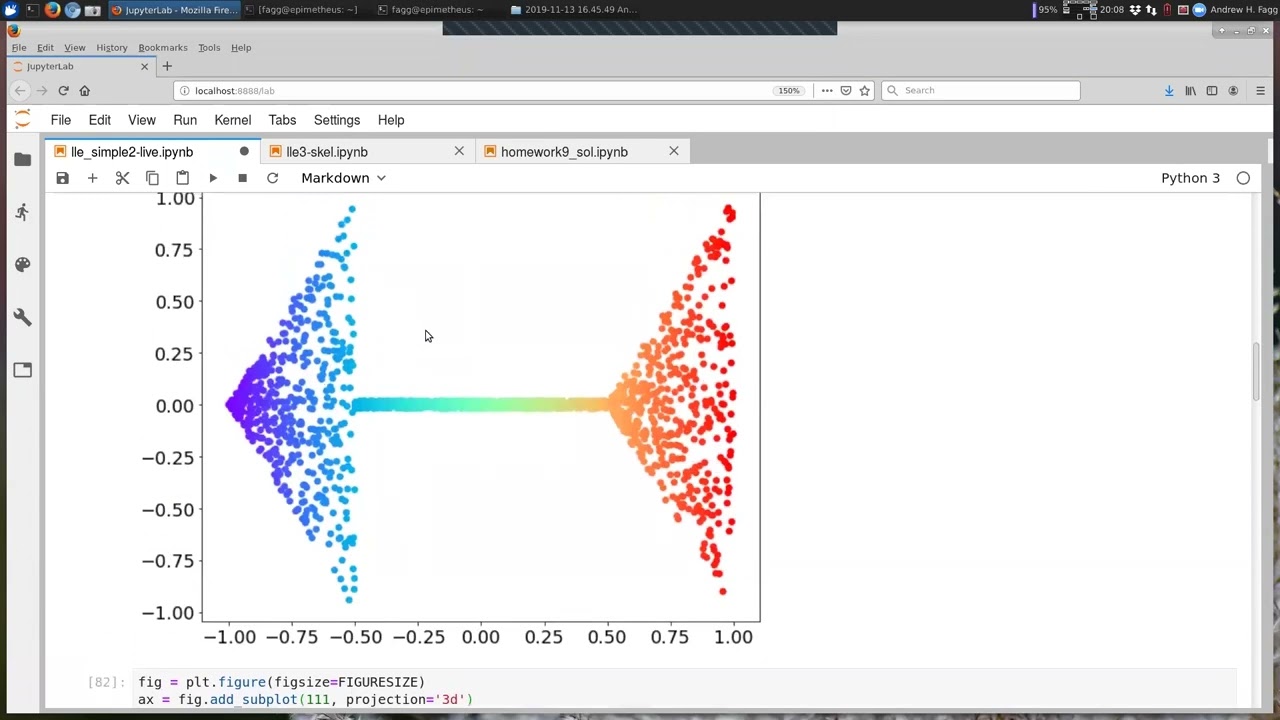
- Switching to Arrow dataset and applying t-SNE with perplexity 5
- Increasing perplexity to 10 and observing split of arrow components
- Increasing perplexity to 20 and noting better representation
- Increasing perplexity to 40 and achieving connected representation
- Trying perplexity 60 and noting minimal change, concluding remarks
Contribution & Novelties
The video provides a clear, step-by-step demonstration of t-SNE’s behavior with different perplexity values, which is useful for practitioners learning to use t-SNE. It does not introduce new methods or theoretical insights, but it reinforces practical understanding. The main novelty is the visual comparison across perplexity values on two datasets.
Pour aller plus loin :
- t-SNE (Wikipedia) — Overview of t-SNE algorithm and its parameters.
- Visualizing Data using t-SNE (original paper) — Original paper by van der Maaten and Hinton.
- How to Use t-SNE Effectively — Distill article on common pitfalls and best practices.
94 words
Radar Profile
The radar profile shows moderate scores across all dimensions, with slightly higher quality and reliability compared to quantity and technical level. This indicates a balanced but not exceptional tutorial, suitable for beginners but lacking depth for advanced users.