Example: Regression Trees
Keywords
Summary
111 words
Critical Evaluation
Value of the Information & Strength of the Argument
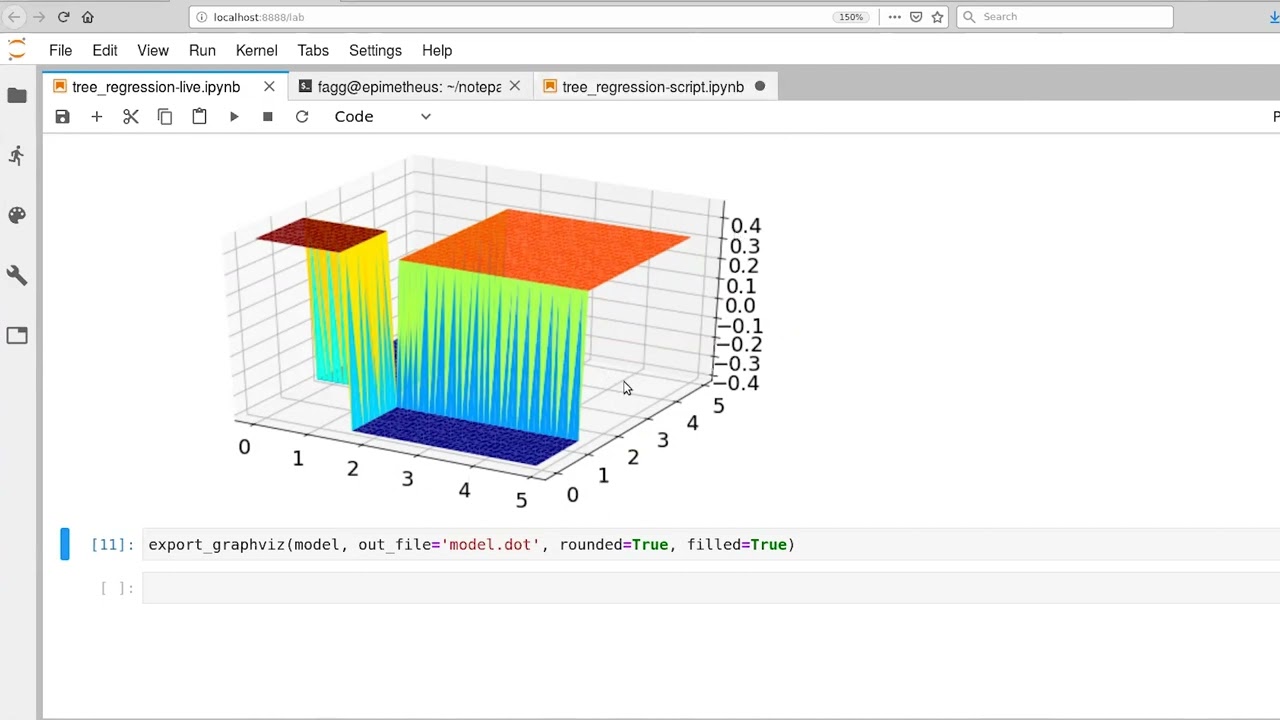
The video provides a clear and practical demonstration of regression trees, showing how to implement them with Scikit-Learn and visualize the results. The argumentation is solid, as it systematically explores the effects of different hyperparameters on model complexity and performance. The presenter explains the concept of piecewise constant functions and how tree depth and leaf nodes affect the granularity of the approximation. The use of 3D plots and tree diagrams enhances understanding. However, the video lacks a formal comparison of model performance metrics and does not discuss potential overfitting or cross-validation, which are important considerations in practice.
Scientific Rigor, Source Quality, Title Accuracy
The video is a tutorial and does not cite external sources. It relies on the Scikit-Learn library and Graphviz for visualization, which are well-established tools. The content is technically accurate and aligns with standard machine learning practices. The title accurately reflects the content, which is a practical example of regression trees. The video does not include any formal citations or references, but the information presented is reliable based on the presenter’s expertise and the use of standard tools.
190 words
Title / Content Match
The title accurately reflects the content, which is a practical example of regression trees using Scikit-Learn.
Quality & Reliability
7/10
The video is a practical tutorial demonstrating regression trees using Scikit-Learn. It provides clear explanations of key concepts such as max depth, max leaf nodes, and visualization using Graphviz. The content is accurate and aligns with standard machine learning practices, though it lacks formal citations and in-depth theoretical background.
Key Moments
Markers derived by PSI from the transcript: the creator did not define chapters.
- Introduction and setup: importing libraries and loading dataset.
- Fitting a regression tree with max depth 2 and visualizing the 3D surface.
- Exporting the tree to Graphviz and viewing the structure.
- Fitting a tree with max depth 3 and observing more surfaces.
- Fitting a tree with max depth 10 and noting the complexity.
- Using max leaf nodes instead of max depth and observing adaptive splits.
- Increasing leaf nodes and seeing better approximation of the surface.
- Final demonstration with many leaf nodes and conclusion.
Cited Sources
- Scikit-Learn Documentation — Referenced implicitly as the library used for regression trees.
- Graphviz — Used for visualizing the decision tree structure.
Concurring Sources
- Scikit-Learn Documentation — The video's usage of DecisionTreeRegressor aligns with the library's official documentation.
Contribution & Novelties
The video provides a clear, hands-on demonstration of regression trees, showing how to implement and visualize them. It effectively illustrates the impact of hyperparameters like max depth and max leaf nodes on model complexity and approximation quality. The use of 3D plots and tree diagrams helps in understanding the piecewise constant nature of regression trees.
Pour aller plus loin :
- Decision Tree Learning — Provides a broader overview of decision tree algorithms.
- Overfitting in Machine Learning — Relevant to understanding the trade-offs of increasing tree complexity.
- Cross-Validation — Important for evaluating model generalization, which the video does not cover.
99 words
Radar Profile
The radar profile shows a balanced performance across all dimensions, with slightly higher scores in information quantity and quality, indicating a solid tutorial that provides useful content and reliable information, though it may lack depth in technical rigor and novelty.
💬 No comments were provided for analysis.