Example: Computing Classifier Metrics
Keywords
Summary
135 words
Critical Evaluation
Value of the Information & Strength of the Argument
The video provides a practical, hands-on demonstration of computing classifier metrics, which is valuable for learners who want to apply theoretical concepts. The argumentation is clear and logical, walking through the process step-by-step. The presenter explains the intuition behind each metric and how to interpret the visualizations. However, the video does not delve into the mathematical derivations or deeper theoretical aspects, limiting its value for advanced audiences. The argumentation is solid for an introductory tutorial, but it lacks critical analysis of the methods’ limitations or alternatives.
Scientific Rigor, Source Quality, Title Accuracy
The video does not cite any external sources or references. The content is based on the presenter’s own knowledge and the use of scikit-learn documentation implicitly. The title accurately reflects the content, which is a tutorial on computing classifier metrics. The lack of citations reduces the scientific rigor, but the practical nature of the tutorial mitigates this. The video is well-structured and the explanations are consistent with standard machine learning practices.
172 words
Title / Content Match
The title accurately reflects the content, which focuses on computing classifier metrics in a practical coding example.
Quality & Reliability
7/10
The video provides a clear, step-by-step tutorial on computing classifier metrics using Python and scikit-learn. The explanations are accurate and align with standard practices. However, it lacks formal citations and references, and the content is introductory without deep theoretical rigor.
Key Moments
Markers derived by PSI from the transcript: the creator did not define chapters.
- Introduction: overview of the tutorial on computing classifier metrics.
- Plotting the distribution of scores using matplotlib's hist function.
- Separating scores by true labels using list comprehensions.
- Plotting histograms for positive and negative scores with transparency.
- Computing ROC curve using scikit-learn's roc_curve function.
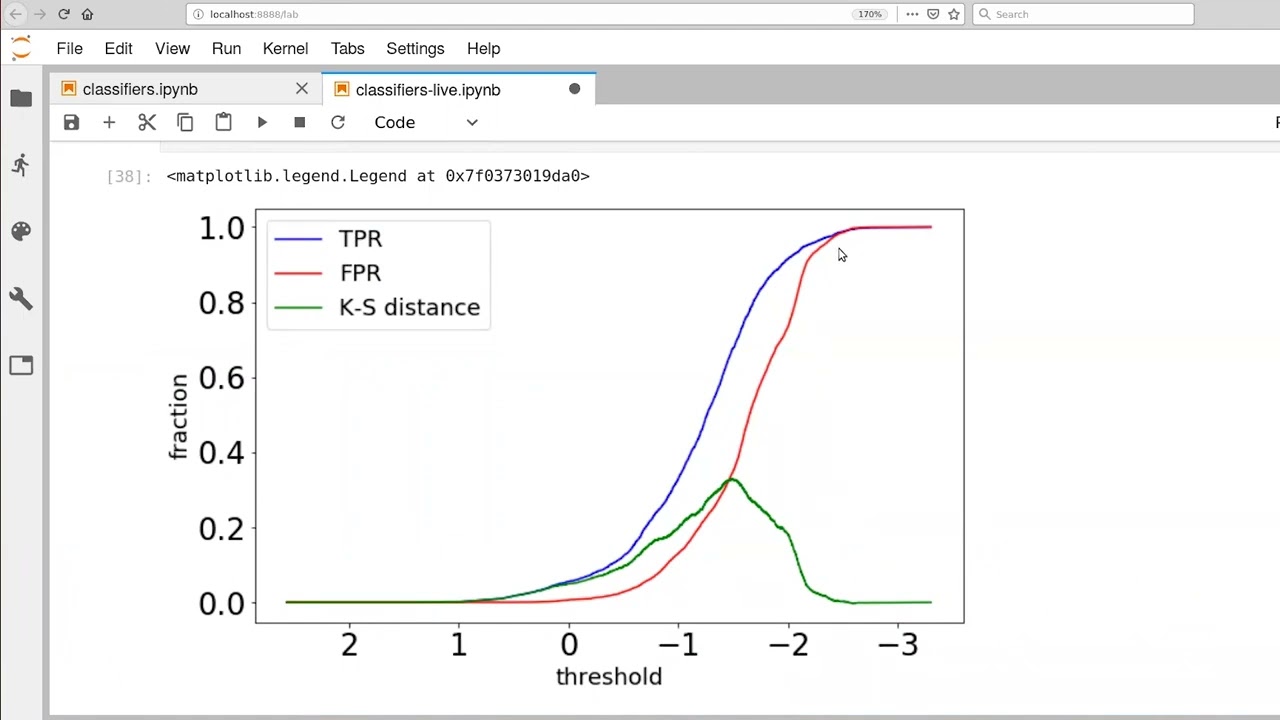
- Plotting TPR, FPR, and KS distance as functions of threshold.
- Plotting the ROC curve with the diagonal reference line.
- Interpreting the ROC curve and discussing threshold selection.
- Calculating AUC using scikit-learn's auc function.
- Discussion on class imbalance and future topics.
Contribution & Novelties
The video provides a clear, practical demonstration of computing classifier metrics, which is useful for beginners. It bridges the gap between theory and implementation by showing code and visualizations. The main novelty is the step-by-step approach to building ROC curves and interpreting them.
Pour aller plus loin :
- ROC curve - Wikipedia — Provides a comprehensive overview of ROC curves and related concepts.
- scikit-learn documentation: roc_curve — Official documentation for the roc_curve function used in the video.
- Area under the curve (AUC) - Wikipedia — Explains the AUC metric and its interpretation.
92 words
Radar Profile
The radar profile shows moderate scores across all dimensions, with slightly higher quality and reliability compared to quantity and technical depth. This indicates a balanced but not exceptionally deep tutorial, suitable for introductory learning.