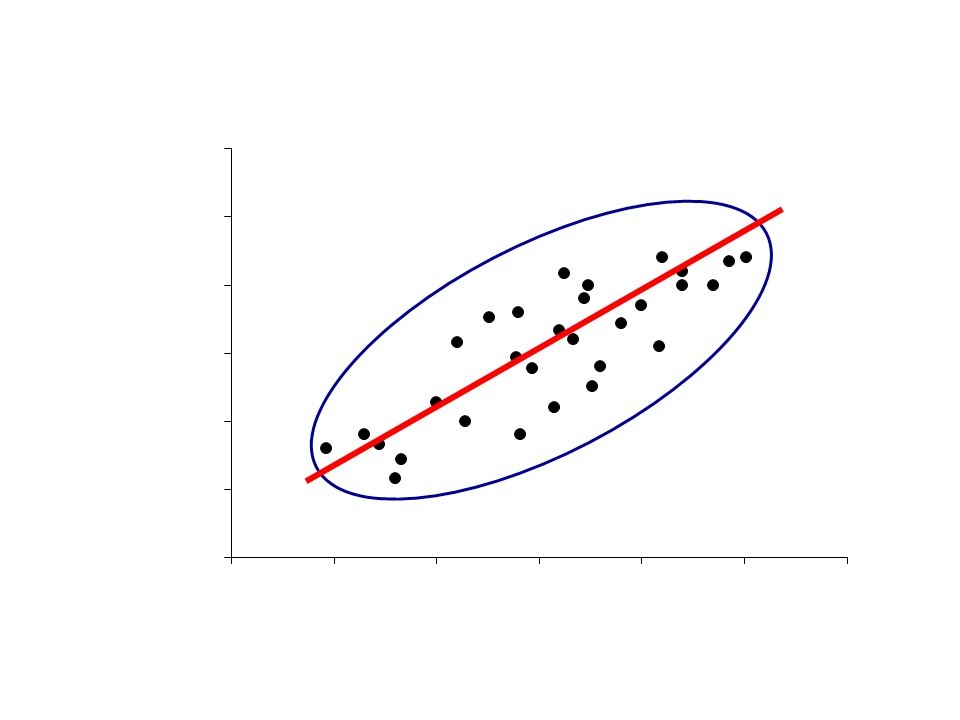
Corrélation linéaire simple
Keywords
Summary
174 words
Critical Evaluation
Value of the Information & Strength of the Argument
The video provides a solid foundation in correlation analysis, explaining both conceptual and computational aspects. The argumentation is clear and logical, building from a practical example to the mathematical definition of the correlation coefficient. The author effectively uses visual aids and analogies to illustrate the least squares method and the interpretation of R. The distinction between the strength of correlation and its significance is well articulated, and the discussion of conditions and limitations adds depth. The video also appropriately warns against overinterpreting correlation as causation, a common pitfall.
Scientific Rigor, Source Quality, Title Accuracy
The scientific rigor is high: the content is accurate and follows standard statistical methodology. The author, Thierry Ancelle, is an epidemiologist, lending credibility. However, no specific sources are cited within the video itself; the description provides links to the author’s educational platform and related videos. The title accurately reflects the content, which is a focused tutorial on simple linear correlation. The video is well-structured and the explanations are precise, though the mathematical derivations are not shown in detail, which is acceptable for an introductory tutorial.
188 words
Title / Content Match
The title accurately reflects the content, which is a comprehensive introduction to simple linear correlation.
Quality & Reliability
8/10
Clear and rigorous explanation of linear correlation, covering concepts, formulas, interpretation, and conditions of application. The author is an epidemiologist and the content is well-structured. However, no external sources are cited in the video itself, and the mathematical derivations are not shown in detail.
Key Moments
Markers derived by PSI from the transcript: the creator did not define chapters.
- Introduction to measuring the relationship between two quantitative variables
- Explanation of the least squares regression line
- Definition and calculation of the correlation coefficient
- Testing the significance of the correlation coefficient using t-test
- Interpretation of correlation test results
- Conditions of application and limitations of correlation
Cited Sources
- Formation Epiter - Statistics and Epidemiology courses — List of complete courses in Statistics and Epidemiology
- QCM Quizz - Exercises and quizzes — Exercises, QCM and quizzes for practice
- Related video: Spearman rank correlation — Mentioned as a related topic on rank correlation
- Related video: Linear regression — Mentioned as a related topic on linear regression
- Related video: Causality — Mentioned as a related topic on causality
- Related video: Statistical tests — Mentioned as a related topic on statistical tests
- Related video: Time series — Mentioned as a related topic on time series
- Related video: Outliers — Mentioned as a related topic on outliers
Concurring Sources
- Pearson correlation coefficient - Wikipedia — Provides mathematical definition and properties consistent with the video.
- Least squares - Wikipedia — Explains the method of least squares used to fit the regression line.
Contribution & Novelties
This video provides a clear and accessible introduction to simple linear correlation, emphasizing conceptual understanding over mathematical derivation. It effectively uses a concrete example and visual aids to explain the least squares method and the correlation coefficient. The distinction between the strength of correlation and its statistical significance is well highlighted, and the conditions for application are discussed. The video also warns against the common misinterpretation of correlation as causation.
Pour aller plus loin :
- Pearson correlation coefficient — Detailed mathematical definition and properties.
- Least squares — Explanation of the method of least squares.
- Student’s t-test — Background on the t-test used for significance testing.
- Correlation does not imply causation — Discussion of the logical fallacy.
- Spearman’s rank correlation — Non-parametric alternative mentioned in the video.
126 words
Radar Profile
The radar profile shows high scores in information quantity, quality, and reliability, with a moderate technical level. This indicates a well-balanced educational video that is both informative and accessible, suitable for learners with some statistical background.
💬 No comments were provided for analysis.