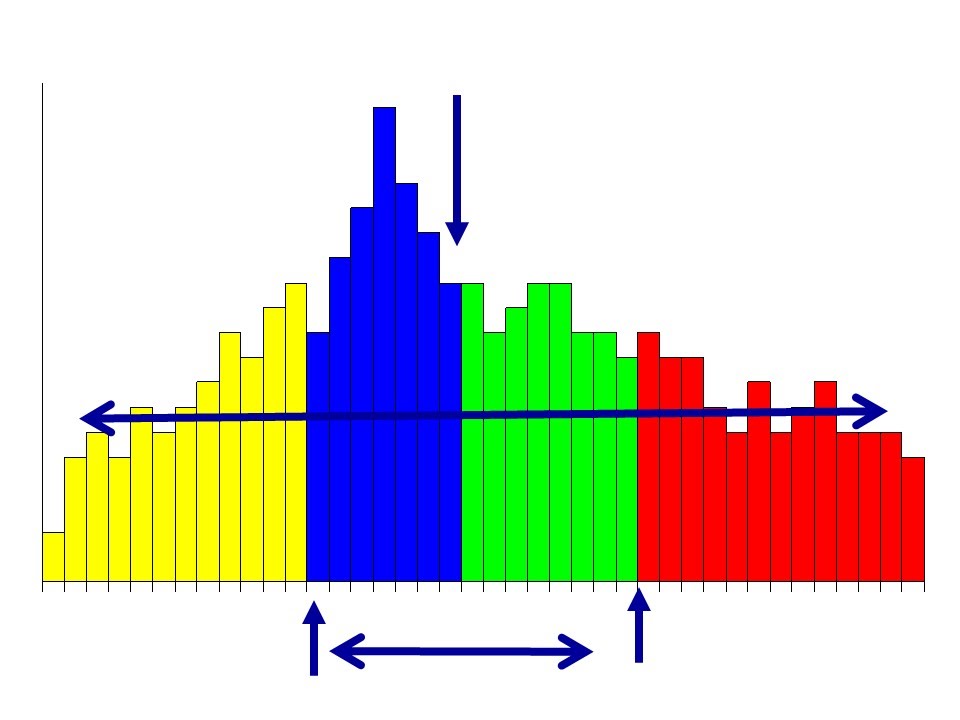
Paramètres descriptifs d'une distribution
Keywords
Summary
147 words
Critical Evaluation
Value of the Information & Strength of the Argument
The video provides valuable information for understanding descriptive statistics. It clearly explains the purpose and calculation of each parameter, using a consistent example to facilitate comprehension. The argumentation is solid: the instructor justifies the use of each parameter, highlights their limitations (e.g., sensitivity of the mean to outliers), and provides practical guidance on when to prefer one parameter over another. The use of Excel demonstrations adds practical value, making the content directly applicable. The explanations are logical and build upon each other, from simple measures like the mean to more complex ones like variance and standard deviation.
Scientific Rigor, Source Quality, Title Accuracy
The scientific rigor is adequate for an introductory tutorial. The content is accurate and aligns with standard statistical definitions. However, the video does not cite external sources or references; it relies on the instructor’s expertise. The title accurately reflects the content, which focuses on descriptive parameters of a distribution. The video is well-structured and follows a logical progression, ensuring clarity. No comments were provided for analysis.
178 words
Title / Content Match
The title accurately reflects the content, which covers the main descriptive parameters of a distribution.
Quality & Reliability
8/10
The video provides a clear, step-by-step explanation of descriptive statistics parameters, with practical examples and Excel demonstrations. The content is accurate and well-structured, though it is an introductory tutorial without in-depth mathematical derivations or citations.
Key Moments
Markers derived by PSI from the transcript: the creator did not define chapters.
- Introduction to the mean: calculation and Excel function.
- Explanation of the median and its properties.
- Introduction to quantiles: quartiles, deciles, percentiles.
- Interquartile range and its use.
- Variance: concept, calculation, and Excel function.
- Standard deviation: definition and interpretation.
- Coefficient of variation and its application.
Cited Sources
- Formation Epiter — Course materials and full list of statistics and epidemiology courses.
- QCM Quizz — Exercises, quizzes, and QCM for practice.
Concurring Sources
- Descriptive statistics — General reference for descriptive statistics.
External References
Contribution & Novelties
The video provides a clear and structured introduction to descriptive statistics, with a strong emphasis on practical application using Excel. It effectively explains the concepts and their limitations, making it a valuable resource for beginners. The use of a consistent example throughout enhances understanding.
Pour aller plus loin :
- Descriptive statistics — Overview of descriptive statistics.
- Empirical rule — Interpretation of standard deviation for normal distributions.
- Quantile — General concept of quantiles.
72 words
Radar Profile
The radar profile shows high scores in quantity and quality of information, with a moderate technical level. This indicates a comprehensive yet accessible tutorial, suitable for beginners. The reliability is high, reflecting the accuracy of the content.