Degrés de liberté
Keywords
Summary
189 words
Critical Evaluation
Value of the Information & Strength of the Argument
The video provides substantial educational value by demystifying a concept that often confuses students. It systematically covers the degrees of freedom for various statistical tests, including chi-square, t-tests (independent, paired, Welch), correlation, and ANOVA. The argumentation is solid: each formula is derived from the principle of constraints, and examples illustrate the calculations. The presenter explains why df matters (e.g., choosing critical values) and when to use different tests (e.g., Welch when variances are unequal). The reasoning is logical and builds from simple to complex cases, making it accessible to learners. However, the video does not delve into the mathematical derivations or the underlying theory, but for an introductory tutorial, this is acceptable.
Scientific Rigor, Source Quality, Title Accuracy
The video demonstrates scientific rigor by presenting standard statistical formulas and concepts accurately. The presenter correctly explains the df for chi-square tests, t-tests, and ANOVA, and appropriately notes conditions such as homoscedasticity. The sources cited are limited to the presenter’s own educational resources (formation.epiter.org and qcmquizz.free.fr), which are not peer-reviewed but are relevant for further practice. The title ‘Degrés de liberté’ accurately reflects the content, which is entirely focused on this topic. The video does not include external references, but the explanations are consistent with established statistical theory. Overall, the scientific quality is high for an educational video, though it lacks formal citations.
230 words
Title / Content Match
The title accurately reflects the content, which focuses exclusively on the concept of degrees of freedom in statistical tests.
Quality & Reliability
8/10
The video provides a clear and accurate explanation of degrees of freedom in common statistical tests, with correct formulas and examples. The content aligns with standard statistical theory, and the pedagogical approach is sound. Minor limitations include a lack of formal citations and some approximations (e.g., rounding Welch's df), but overall it is reliable for educational purposes.
Key Moments
Markers derived by PSI from the transcript: the creator did not define chapters.
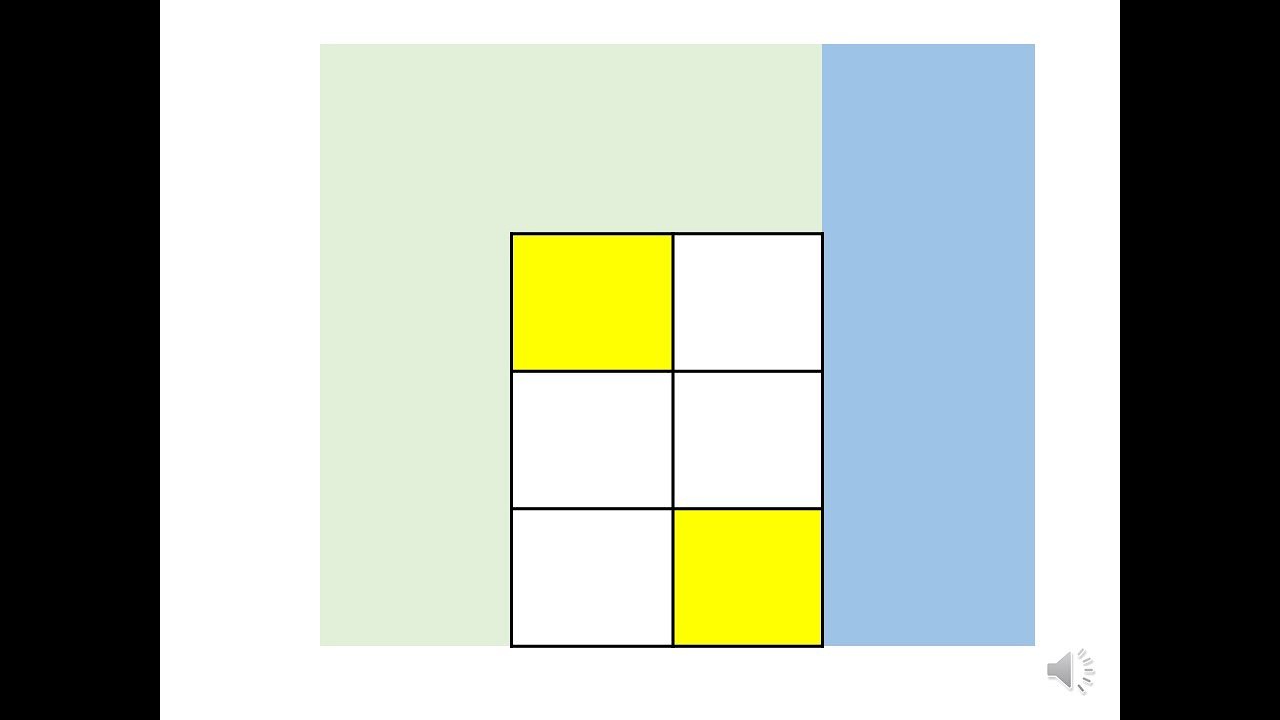
- Introduction to degrees of freedom with geometric analogy (line in a plane)
- Degrees of freedom for quantitative variables (n-1)
- Student's t-test for comparing two means: df = n1+n2-2
- Welch's t-test for unequal variances and its df formula
- Paired t-test: df = n-1
- Correlation test: df = n-2
- ANOVA and F-test: two types of df (between and within groups)
Cited Sources
- Formation Epiter - Statistics and Epidemiology courses — Mentioned as the source for the full list of courses on statistics and epidemiology.
- QCM Quizz - Exercises and quizzes — Mentioned as the source for exercises, QCMs, and quizzes.
- Related video: nchH22qmtmc — Listed as a related topic in the video description.
- Related video: 8nEMxrS-5_0 — Listed as a related topic in the video description.
- Related video: IKTSaKvqj1Y — Listed as a related topic in the video description.
- Related video: r4SaFaA0uxk — Listed as a related topic in the video description.
Concurring Sources
- Degrees of freedom (statistics) - Wikipedia — Confirms the general definition and formulas for df in various statistical contexts.
- Student's t-test - Wikipedia — Supports the df calculation for independent two-sample t-tests (n1+n2-2).
- Welch's t-test - Wikipedia — Validates the use of Welch's test and its df formula for unequal variances.
Contribution & Novelties
This video offers a clear and systematic explanation of degrees of freedom in statistics, using intuitive examples and visual aids. It covers a wide range of tests (chi-square, t-tests, ANOVA) and clarifies why df differ across tests. The pedagogical approach is effective for learners, and the summary table at the end is a useful reference. While the content is not novel for experts, it serves as a valuable educational resource.
Pour aller plus loin :
- Degrees of freedom (statistics) — Provides a comprehensive overview of the concept and its applications.
- Student’s t-test — Detailed explanation of the t-test, including assumptions and variations like Welch’s test.
- Welch’s t-test — Discusses the adaptation for unequal variances and the calculation of degrees of freedom.
- Analysis of variance — Explains ANOVA and the F-test, including the degrees of freedom for between and within groups.
140 words
Radar Profile
The radar profile shows high scores in information quantity, quality, and reliability, with a slightly lower technical level. This indicates a well-structured educational video that is both informative and trustworthy, though it may not delve into advanced mathematical details.
💬 No comments were provided for analysis.