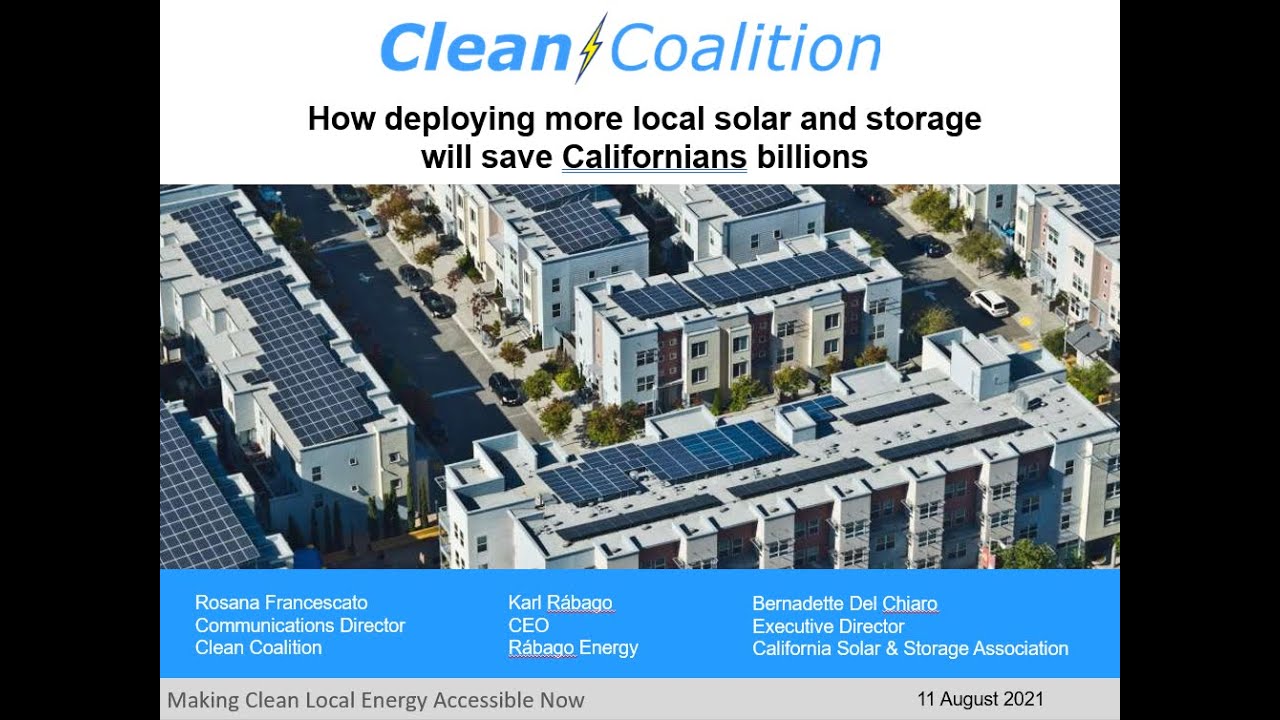
How deploying more local solar and storage will save Californians billions
Keywords
Summary
161 words
Critical Evaluation
Value of the Information & Strength of the Argument
The value of the information is high in terms of introducing a sophisticated modeling approach (WIS-dom-P) that challenges conventional utility planning. The argumentation is well-structured: they first explain the current market distortions, then present the model’s capabilities, and finally show the quantitative results (savings, jobs, emissions). However, the argument is somewhat one-sided as it relies entirely on the study’s assumptions and does not present counterarguments or independent validation. The presenters are industry advocates, which may introduce bias. The logic is coherent, but the claimed $120 billion savings depends on model inputs such as solar and storage costs, which are not critically examined.
Scientific Rigor, Source Quality, Title Accuracy
The scientific rigor is moderate: the study uses a state-of-the-art model but the methodology is only summarized, not peer-reviewed. The sources cited include the WIS-dom-P model by Vibrant Clean Energy and the local Solar for All Coalition, but no URLs are provided in the video description. The title is a good match for the content. The presentation is part of a webinar series, so it is educational but also promotional. The quality of sources could be improved by linking to the actual study report. The transmission access charge reform discussion is based on the Clean Coalition’s analyses, which are not independently verified. Overall, the title is accurate, but the scientific robustness is limited by the lack of detailed references.
236 words
Title / Content Match
The title accurately reflects the main conclusion: deploying more local solar and storage saves billions. The content directly supports this claim.
Quality & Reliability
7/10
The webinar presents findings from a sophisticated modeling study (WIS-dom-P) by Vibrant Clean Energy, but the presentation is advocacy-oriented with industry representatives. The methodology is described in detail, but independent verification is not provided.
Key Moments
Markers derived by PSI from the transcript: the creator did not define chapters.
- Introduction by Rosanna Franciscus on Clean Coalition and the importance of local renewables
- Explanation of transmission access charge (TAC) distortions
- Karl Rábago introduces the WIS-dom-P model and its capabilities
- Description of the two scenarios compared: utility-scale vs local solar+storage
- Key results: savings of $120 billion, 60 GW storage, 374,000 jobs
- Detailed explanation of how distributed resources shape demand and reduce peak costs
- Bernadette Del Chiaro discusses policy implications and next steps
Cited Sources
- WIS-dom-P model by Vibrant Clean Energy — Used for the study's modeling, described as the most advanced utility planning model.
- Local Solar for All Coalition study — The study presented in the webinar, based on WIS-dom-P.
Concurring Sources
- Renewable energy cost analyses — IRENA reports often support declining costs of renewables, aligning with the study's assumptions.
Dissenting Sources
- Critics of distributed generation cost-effectiveness — Some utility studies argue that utility-scale solar is cheaper due to economies of scale, a viewpoint the webinar counters.
Contribution & Novelties
The webinar provides a novel application of advanced modeling to demonstrate the cost-effectiveness of distributed solar and storage, challenging traditional economies of scale assumptions. It quantifies the value of transmission access charge reform in enabling this transition. The originality lies in the integrated optimization of distribution and transmission grids, which is rarely done in utility planning.
Pour aller plus loin :
- Distributed generation — Overview of distributed generation concepts.
- Energy storage — General background on storage technologies.
- California Independent System Operator — Context on grid operation in California.
- Transmission access charge — Related to grid cost allocation (note: general concept, not specific to California).
104 words
Radar Profile
The profile shows high scores in information quantity and technical level, but moderate scores in quality and reliability. This reflects a detailed but advocacy-oriented presentation with sophisticated modeling yet limited independent verification.