Semiconductor Reliability in Practice: Weibull Plots, System & Activation Energy | 2026 L6
Keywords
Summary
169 words
Critical Evaluation
Value of the Information & Strength of the Argument
The lecture provides high practical value by demonstrating how to transform raw failure data into Weibull plots via clear step-by-step calculations, including a hand-worked example. The argumentation is logically structured: it starts with the physical justification for choosing Weibull over lognormal, then shows the math, and finally ties results to physical mechanisms (e.g., slope changes indicating multiple failure modes). The instructor emphasizes the importance of defining failure criteria and understanding the physics behind the statistics, which strengthens the credibility of the approach. However, the argumentation could be more explicit in comparing the method’s limitations or alternative statistical approaches, but overall it is coherent and convincing.
Scientific Rigor, Source Quality, Title Accuracy
The lecture is scientifically rigorous in its use of standard reliability theory and statistical methods, but it lacks explicit citations to external sources. The only reference mentioned is a textbook example (Example 4.3) without specifying the textbook title or author. The instructor’s explanations are consistent with well-known principles in semiconductor reliability, but no references to literature are provided. The title succinctly captures the three core topics: Weibull plots, system reliability, and activation energy, and the content directly addresses these. The lecture does not misrepresent or overstate claims; it remains at an appropriate technical level for graduate students.
217 words
Title / Content Match
The title accurately reflects the content, covering Weibull plots, system reliability, and activation energy in semiconductor reliability.
Quality & Reliability
8/10
The lecture provides a rigorous step-by-step explanation of Weibull plot construction and system reliability analysis, grounded in established reliability theory, but lacks explicit citations and relies primarily on the instructor's expertise.
Key Moments
Markers derived by PSI from the transcript: the creator did not define chapters.
- Introduction and recap: lognormal vs. Weibull distributions for degradation types.
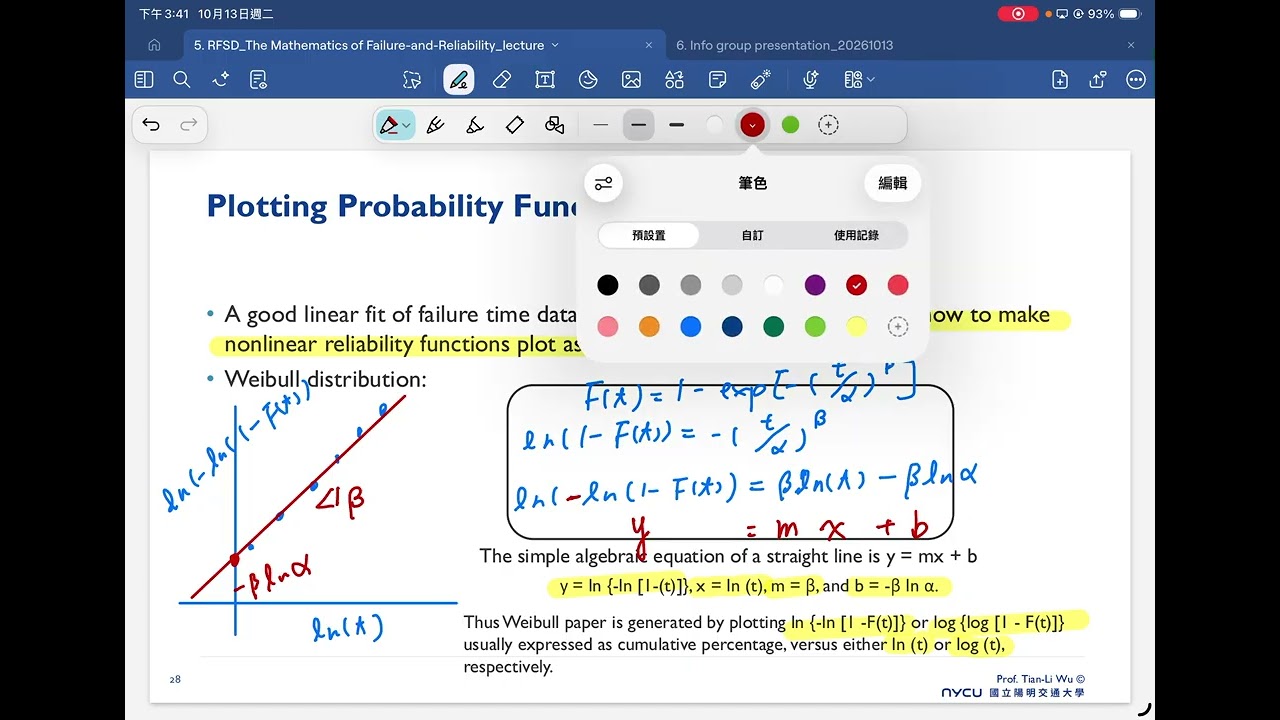
- Mathematical linearization of the Weibull distribution to enable straight-line plotting.
- Explanation of Bernard's approximation for ranking failure data and estimating cumulative distribution functions.
- Worked example: 60 devices, 7 failures, step-by-step construction of a Weibull plot by hand.
- Discussion on multiple failure populations and interpretation of distinct slopes in Weibull plots.
- Transition to system reliability: series and parallel systems, multiplication and complement rules.
- Dielectric area scaling and Arrhenius analysis for extracting activation energy from temperature-dependent data.
- Conclusion: connecting statistical analysis to failure physics and practical insights.
Cited Sources
- Textbook example 4.3 (unspecified) — Used as the source for the worked example of building a Weibull plot from failure data.
Contribution & Novelties
The lecture’s original contribution lies in its thorough, step-by-step demonstration of converting experimental TDDB data into physically meaningful reliability parameters (Weibull slope, characteristic lifetime, activation energy), effectively bridging the gap between theoretical statistics and practical failure analysis. It explicitly shows how to perform all calculations manually, which enhances comprehension of the method’s foundations.
Pour aller plus loin :
- Weibull distribution — Core statistical distribution used in reliability and failure analysis.
- Arrhenius equation — Basis for activation energy extraction and temperature-dependent acceleration.
- Time-dependent dielectric breakdown — Direct application of the Weibull analysis in semiconductor reliability.
94 words
Radar Profile
The radar profile shows balanced strengths across quantity, quality, and technical level, with slightly lower score in global reliability due to the absence of explicit citations. This indicates a lecture that is informative and well-presented but relies heavily on the instructor's authority rather than external references.